You hit publish. The traffic comes in. And then crickets.
If you’re wondering what’s missing, these CRO statistics for 2026 reveal where conversions break down and what high-performing brands are doing differently.
CRO Statistics: Key Findings
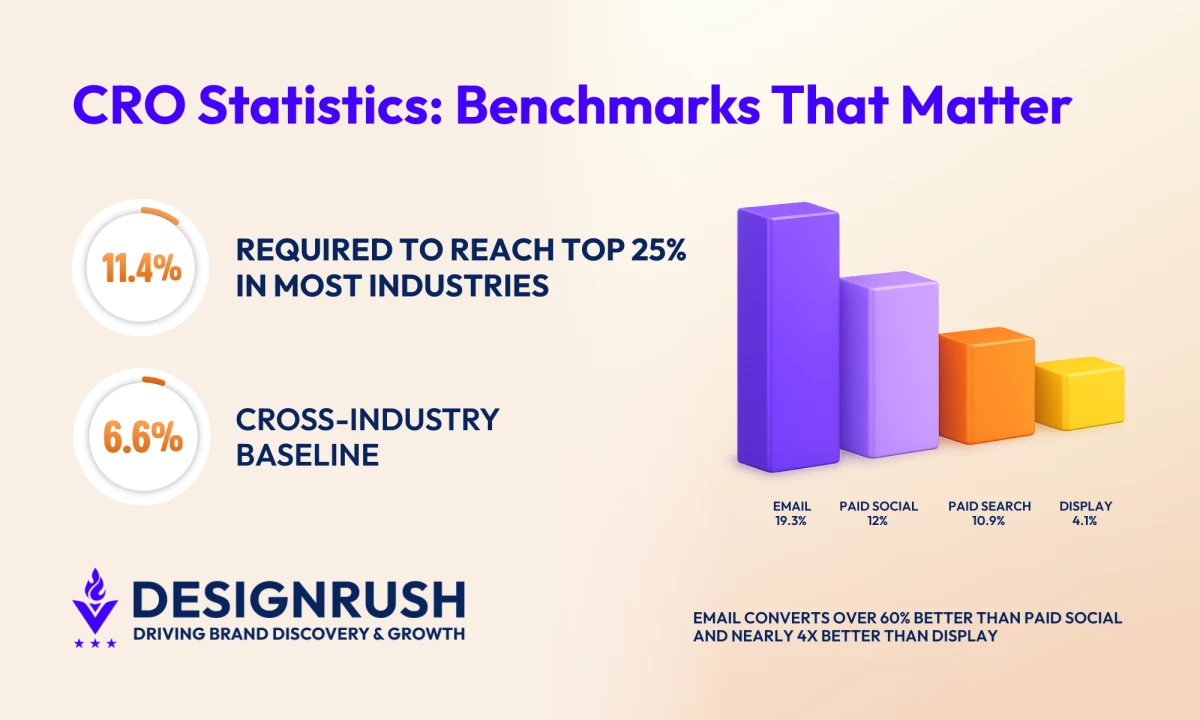
- Email remains the highest-performing channel at 19.3%, converting significantly more traffic than paid search, paid social, or display.
- The 6.6% cross-industry average conversion rate is a baseline for context, not a performance target to chase.
- Mobile gets 82.9% of landing page visits, yet desktop converts roughly 8% more efficiently, revealing an optimization gap.
What Is CRO & Why Do CRO Statistics Matter?
Conversion rate optimization, or CRO, is the practice of improving your website and marketing funnel to increase the percentage of visitors who take action.
That action could be making a purchase, signing up for a trial, downloading a resource, or booking a consultation.
CRO focuses on improving the elements that influence decisions, including:
- Funnel friction points
- Landing page structure
- Page design and layout
- Call to action placement
- Messaging and content clarity
- User experience and navigation
The goal is simple: get better results.
This is where CRO statistics become essential. A 2% conversion rate might seem reasonable until you compare it to your industry average. Benchmarks help you decide where to invest, what to test, and which channels need attention.
What Is a Good Conversion Rate in 2026?
The median landing page conversion rate across industries is 6.6%, based on Unbounce’s analysis of 41,000 landing pages, 464 million pageviews, and 57 million conversions.
Now, that 6.6% is a baseline, not a target. Conversion rates differ greatly by industry, audience intent, and offer type.
To reach the top 25% of performers in many industries, conversion rates typically start around 11.4% and can exceed 40.8% in high-intent sectors such as entertainment.
In contrast, SaaS landing pages report a median of 3.8%, while commercial and professional service providers average 6.2%.
What This Means in Practice
- For example, a 2% conversion rate may signal room for improvement depending on your industry.
- Comparing performance throughout various industries can distort expectations.
- The goal is steady optimization without chasing arbitrary benchmarks.
Industry-Specific CRO Stats
Below is a closer look at median landing page conversion rates across key industries, based on Unbounce’s Conversion Benchmark Report:
- SaaS: 3.8%
- Ecommerce: 4.2%
- Health and wellness: 5.1%
- Commercial and professional services: 6.1%
- Travel and hospitality: 4.8%
- Financial services and insurance: 8.3%
- Legal: 6.3%
- Education: 8.4%
- Events and entertainment: 12.3%
Industry ranges are wide, so an all‑industries figure around 6.6% isn’t meant for goal‑setting.
Not all conversions are comparable. Ecommerce typically tracks purchases, while finance or education usually measures lead submissions or inquiries. The friction involved in completing that action significantly affects the rate.
Also, internal segmentation matters as much as industry. Brand vs. non-brand traffic, mobile vs. desktop users, and new vs. returning visitors can shift conversion performance by two to three times within the same company.
Hitting the median may be a reasonable target for newer programs, but serious teams chase the 75th percentile in their segment once tracking and creative ops are stable.
High-performing industries frequently benefit from stronger intent signals. Events, education and finance often capture higher‑intent actions (RSVP, inquiry for a major decision), so even small % lifts move CAC (Customer Acquisition Cost) quickly.
- SaaS at 3.8%: Why Conversion Rates Run Lower
- Ecommerce at 4.2%: Why Your Best Channel Isn’t Paid
- Finance at 8.3%: The Rare Industry Where Mobile Converts Higher
- Entertainment at 12.3%: Why Intent Runs Higher Here
SaaS at 3.8%: Why Conversion Rates Run Lower
SaaS remains one of the most challenging industries for conversion rate optimization.
Complex pricing models, longer decision cycles, and demo-driven funnels naturally compress top-of-funnel conversion rates compared to other sectors.
Here’s what the data shows:
- Median SaaS landing page conversion rate is 3.8%, significantly below the 6.6% all-industry baseline.
- Hardware SaaS pages convert at 4.1%, while data and infrastructure pages convert at 3.3%.
- Email converts at 16.9%, more than 4x the rate of any other channel in SaaS.
- Paid search (4.1%) outperforms paid social (2.9%) in median performance.
- Google Ads convert at 5.1%, more than 2.5x higher than Bing (1.9%).
- Instagram converts at 9.2%, nearly 3x better than Facebook (3.5%) at the median level.
- 79% of SaaS landing page traffic is mobile, yet mobile and desktop conversion rates are nearly identical.
- Simple copy converts 514% better than complex copy. Pages written at a 5th-7th grade level convert at 12.9%, compared to 2.1% for professional-level readability.
SaaS conversion performance is heavily influenced by clarity.
Simplified value propositions, strong email nurture flows, and mobile-first landing experiences regularly outperform more sophisticated but cluttered approaches.
Email stands out as the primary conversion engine in SaaS. Paid channels can generate traffic, but long-term growth frequently depends on nurturing that traffic through well-optimized onboarding and follow-up sequences.
Ecommerce at 4.2%: Why Your Best Channel Isn’t Paid
Ecommerce behaves very differently from SaaS. Purchase intent is often clearer, the action is immediate, and the margin for friction is thin.
What stands out most to me is how strongly channel mix and device experience influence performance.
Here are the details:
- Ecommerce conversion rate: 4.2%
- Email converts at 28.6%, outperforming paid channels by 5–6x
- Google paid search converts at 5.7%, compared to Bing at 3.7%
- TikTok converts at 12.5%, with top-performing posts reaching 36.5%
- Paid search (5.1%) and paid social (4.8%) trail significantly behind email
- Mobile traffic exceeds desktop by 2.5x, yet mobile converts about 18% less often
- Desktop conversion rate: 23.6%
- Mobile conversion rate: 19.4%
Industry subcategories vary widely:
- Food and beverage: 7.1%
- Auto and industrial parts: 5.1%
- Housewares and home furnishings: 3.0%
- Fashion and beauty: 1.3%
Food and beverage benefit from both urgency and repeat purchasing behavior. Fashion and beauty, on the other hand, attract high browsing volume, which can dilute conversion rates unless strong trust signals and product validation are in place.
What I take from this is simple.
Email is the revenue engine. If eCommerce brands underinvest in lifecycle email campaigns, segmentation, and behavior-based personalization, they’re ignoring their highest-converting asset.
Paid search remains important, especially on Google, but paid social is far less consistent.
TikTok is proving powerful when creativity is aligned with platform-native behavior. Facebook can still perform, but only with disciplined targeting and creative refresh cycles.
As Nirav Sheth, Chairman at Anatta, explains:
“A high conversion rate will illustrate that customers enjoy shopping on your site, love your products, and that acquisition efforts are paying off.”
The mobile paradox is real. Traffic skews heavily mobile, but conversion still favors desktop.
That usually signals friction in checkout or payment flow. Improving mobile UX can get you disproportionate gains without increasing traffic spend.
The brands that win are the ones that remove friction faster than competitors.
Additional Ecommerce Benchmarks
Recent global data from Statista reinforces the performance gap across ecommerce verticals.
- Skincare leads at 2.7%
- Food & beverage follows at 2.2%
- All-vertical average: 1.6%
Conversion rates also differ greatly by location. Since 2025, eCommerce sites in Switzerland have consistently outperformed those in the United States and other regions.
And despite mobile traffic dominating overall visits, conversions remain more effective on desktop and tablet devices.
Another pressure point is that cart abandonment globally exceeded 70% in 2025.
In the U.S., the primary reason shoppers abandon checkout is unexpected extra costs such as shipping, taxes, and service fees.
Finance at 8.3%: The Rare Industry Where Mobile Converts Higher
Financial services breaks several patterns we see in other industries. Mobile outperforms desktop, paid media outperforms email, and subcategory performance varies dramatically.
Here’s a snapshot:
- Financial services conversion rate: 8.3%
- Insurance: 18.2%
- Credit and lending: 8.8%
- Investing: 3.9%
- Paid search: 10.1%
- Paid social: 9.3%
- Email: 7.9%
- Google Ads: 10.7%
- Instagram: 15.5%
- TikTok: 10.8%
- Facebook: 10.1%
- Mobile converts 27.8% better than desktop
- Mobile conversion rate: 11.5%
- Desktop conversion rate: 9%
Insurance considerably outperforms the wider financial services average, likely due to higher intent and urgency.
Investing sits well below the industry rate, reflecting longer research cycles and greater friction before commitment.
What stands out to me most is channel behavior. Unlike SaaS or ecommerce, paid search and paid social are the primary conversion drivers here, with Google clearly leading. Email is still viable, but it isn’t the dominant engine.
View this post on Instagram
Mobile performance is also notable. Financial services is one of the few industries where mobile converts meaningfully better than desktop.
That suggests users are comfortable completing financial actions on smaller screens, but it also indicates a missed opportunity for desktop optimization.
In this sector, growth typically comes from tightening paid acquisition, refining mobile UX, and improving message clarity among high-intent queries.
Entertainment at 12.3%: Why Intent Runs Higher Here
If there’s one industry that breaks the rules, it’s entertainment. Conversion rates are dramatically higher than in most sectors, and channel dynamics look very different from those in SaaS or ecommerce.
Here are the key benchmarks:
- Entertainment conversion rate: 12.3%
- Sweepstakes: 47.5%
- Publishing: 9.8%
- Games and gambling: 8.1%
- Streaming media: 6.8%
- Email: 46.2%
- Paid social: 14.6%
- Facebook (paid): 14.3%
- Instagram (paid): 11.1%
- Google paid search floor: 5.7%
- Mobile conversion rate: 13.6%
- Desktop conversion rate: 13.5%
- Mobile traffic share: 72%
Sweepstakes significantly lift the industry average. Time-sensitive offers and established audiences create strong conversion momentum.
Even without sweepstakes, publishing, games, and streaming, the industry remains above many cross-industry benchmarks.
Email is the strongest channel by a wide margin, showing the power of owned lists and deadline-driven campaigns. Paid social also performs well, with Facebook converting better than Instagram.
Mobile and desktop perform at nearly identical rates, which is unusual. With 72% of traffic on mobile, both experiences must be equally good.
Mobile vs. Desktop CRO Statistics
With mobile traffic dominating most industries, device-level optimization is no longer optional.
Mobile devices accounted for 62.54% of global website traffic in Q2 2025, according to Statista. After consistently hovering around the 50% mark since 2017, mobile usage surpassed that threshold in 2020 and has continued to expand its share of global web access.
Here’s what the Conversion Benchmark Report tells us:
- 82.9% of landing page visits come from mobile devices
- 17.1% come from desktop
- Mobile conversion rate: 11.2%
- Desktop conversion rate: 12.1%
- Desktop converts roughly 8% better than mobile
The most traffic comes from mobile devices, almost five times more, yet desktop devices still convert more efficiently. The performance gap may appear small at first glance, but at scale it becomes significant.
Based on Statista, Device behavior also varies by region. In markets like India, Nigeria, Ghana, and Kenya, mobile accounts for the majority of web traffic.
On the other hand, mobile represents roughly 45% of online traffic in the United States. These regional differences make mobile optimization even more critical for brands operating globally.
Industry-wide modeling shows that fully optimized mobile experiences could produce more than 1 million additional conversions.
Mobile-first design is not about shrinking a desktop page to fit a smaller screen. It requires refining navigation, tightening above-the-fold messaging, reducing form friction, and improving checkout clarity.
Conversion Rates by Channel
If you want the quickest reality check on where your conversions are coming from, start with the channel.
According to Unbounce’s Conversion Benchmark Report, email converts at 19.3% on average, making it the highest-performing traffic source. Paid social follows at 12%, paid search at 10.9%, and display trails at 4.1%.
Email traffic converts 60% more than paid social, 77% more than paid search, and 370% more than display. The pattern is clear here: warmer audiences convert better.
For example, World of Wonder implemented AI-driven landing page optimization and saw a 19.7% lift in conversions, with one event page increasing from 12.7% to 31.9%. The traffic source did not change. The experience did.
Paid search averages just under 11%, yet aligning landing pages with ad intent can dramatically outperform that baseline. After restructuring its PPC landing experience, School of Rock increased monthly conversions by 250% while reducing cost per conversion by 82%.
Even minor changes can compound quickly. Going ran a simple CTA A/B test and achieved a 104% month-over-month increase in premium trial starts by refining button messaging.
What This Means in Practice
- Build your highest-value offers around email capture and nurture flows, then use paid channels to feed that pipeline.
- Audit your paid traffic landing pages for message mismatch. If your paid search conversion rate sits below 10%, test tighter keyword-to-headline alignment and shorter forms.
- Prioritize CRO efforts on channels with measurable intent. Display traffic may require different goals, such as micro-conversions or list building, instead of direct sales.
- Review conversion rate alongside cost per conversion. A lower conversion rate may still be profitable if acquisition costs are significantly lower.
CRO Performance Snapshot: Internal DesignRush Agency Data
Based on internal DesignRush agency data from 2020 to 2025:
- PPC optimization projects reported conversion rate increases ranging from 22% to 305%
- Google Ads campaigns delivered improvements between 55% and 210%
- Shopify and ecommerce optimization efforts achieved lifts of up to 295%
- Web design and funnel restructuring projects saw increases from 94% to 900%
- Most optimization cycles ran between one and six months
- The majority of projects operated within $5K–$100K budgets, with many high-impact lifts occurring below $20K
What This Means in Practice
- When I see lifts at the higher end of these ranges, it usually signals a broken baseline.
- The biggest gains come from fixing structural issues like slow load speed, form friction, poor mobile UX, or weak ad-to-page alignment.
- In my experience, architecture changes outperform surface tweaks.
- Budget size alone does not determine impact. Some of the strongest percentage gains occurred in sub-$20K engagements where core friction was removed early.
- Most measurable gains occur within one to six months. I typically frame CRO work in 90-day cycles, with larger improvements compounding over the next six months.
- Paid traffic cannot compensate for a leaky funnel. I always prioritize friction removal before increasing ad spend.
- A conversion lift only matters if the economics work. I evaluate CRO using CPA, MER, margin, and payback period, not just percentage increase alone.
Case Study: How HigherVisibility Lifted Conversions Without Buying More Traffic
The pattern in the data above plays out clearly in client work. When Allied Van Lines partnered with HigherVisibility, the goal was to convert more of the traffic the site already had rather than pay to acquire more.
HigherVisibility focused on the experience behind the click. The team used visitor recordings and heatmaps to see how users moved through the site and where they dropped off, then ran a complete on-page technical audit to surface issues limiting performance.
The largest problem was thin, low-quality content across the site, which the team replaced with copy aligned to user intent, including pages built around long-distance moves. Keyword research and prior PPC data guided where new content could capture demand the site was not yet ranking for.
Experts at HigherVisibility emphasize the importance of fixing a site's foundation before spending to acquire more traffic:
"CRO lifts how well you convert the visitors you already have, but paired with SEO and content it raises both the rate and the quality of traffic feeding it, and that's where the compounding results come from."
The results reflect what happens when optimization targets the experience rather than the traffic. Over twelve months, Allied Van Lines saw:
- Organic conversions rise from 94,489 to 103,411, a 9.44% increase year over year.
- Monthly leads grow from roughly 7,800 to 8,600.
- Organic traffic increase only 2.6%, from 466,657 to 479,007 sessions.
What This Means in Practice
- The lift came from removing friction and matching content to intent, not from increasing acquisition spend.
- Session recordings and heatmaps located where users struggled, which is faster and cheaper than redesigning on instinct.
- Thin content is a conversion problem, not only an SEO one. Pages that fail to answer intent lose users before they act.
Final Thoughts on CRO Statistics
Conversion rate optimization in 2026 is no longer about structural alignment. Channel intent, device behavior, industry benchmarks, and economics all working together.
The data makes it pretty clear. Email consistently beats paid traffic. Mobile dominates traffic share. Industry baselines vary widely. And the biggest lifts come from fixing friction.
High-performing brands benchmark against their industry, segment by channel and device, and optimize in disciplined 90-day cycles.
If your conversion rate is below your industry baseline, the issue is rarely traffic volume. And that is exactly where experienced CRO partners make the difference.
![]()
Our team ranks agencies worldwide to help you find a qualified partner. Visit our Agency Directory for the top conversion rate optimization agencies, as well as:
- Top UI/UX Design Agencies
- Top Digital Marketing Agencies
- Top SEO Agencies
- Top PPC Agencies
- Top Conversion Rate Optimization Services in Los Angeles
If conversion performance is lagging, explore our Design Awards to see examples of excellent web design that blends UX trends, messaging precision, and frictionless journeys.
FAQs: CRO Stats
1. What is considered a good conversion rate in 2026?
A good conversion rate depends on your industry. The cross-industry baseline is 6.6%, but SaaS averages 3.8% while entertainment reaches 12.3%. Always benchmark against your vertical and segment by channel and device before setting targets.
2. Why is my website getting traffic but not converting?
Most of the time, it’s either mismatched intent or friction. You’re attracting the wrong audience, or your landing experience makes the action harder than it should be.
Start with a fast audit: check ad-to-headline alignment, make sure mobile loads under 2.5 seconds, move proof and value above the fold, and reduce form fields by 30%-50% before increasing traffic spend.
3. Does mobile-first design really impact conversions?
Yes, and the data makes it hard to ignore. Mobile gets 80%+ of landing page traffic in many industries, yet desktop still converts about 8% better on average.
Closing that gap is one of the fastest ways to improve CAC (Customer Acquisition Cost). Focus on mobile speed, simplified checkout, thumb-friendly CTAs, and frictionless payment options, and evaluate your results.
4. What is the average cart abandonment rate?
The average cart abandonment rate in 2026 is 70.22%, meaning about seven in 10 shoppers leave without buying.
Not all abandonments are preventable, but better checkout design could recover an estimated $260 billion in the US and EU. Unexpected shipping, taxes, and fees remain the leading avoidable cause.
5. How much does CRO cost?
CRO costs range from $10–$500 per month for optimization tools to $1,000–$5,000+ monthly for agency services, with enterprise platforms costing much more.
Focus on ROI rather than budget. Successful CRO improves conversion rates, lowers acquisition costs, and often pays for itself through higher revenue.
6. What percentage of A/B tests actually win?
Most A/B tests don't produce a winning variation. Recent data suggests only 15%–33% deliver statistically significant improvements.
The biggest driver of long-term gains isn't individual wins but consistent testing. Teams that run more high-quality experiments steadily compound conversion improvements over time.
7. Does page speed affect conversions?
Yes. Research shows every additional second of load time can reduce conversions by about 7%, while 53% of mobile visitors abandon pages that take longer than three seconds to load.
Improving page speed boosts conversions, user experience, and search performance simultaneously.