Marketing statistics are essential for understanding trends and making smarter decisions in a competitive landscape. They help businesses focus their efforts, improve strategies, and unlock opportunities for growth. By diving into the numbers, your company can stay ahead of the curve and make every move count.
We’ve compiled a comprehensive list of key statistics for SEO, content marketing, social media, pay-per-click, sales, and more to guide your 2026 marketing strategies.
SEO Statistics
Businesses that utilize data-driven SEO strategies often see better visibility, engagement, and results. Here are important SEO statistics highlighting the latest insights and trends that shape the future of online search.
- Google holds 89.74% of the search engine market as of March 2025.
- The top organic result in Google captures approximately 27.6% of all clicks.
- In 2024, the global SEO market was valued at USD 89.1 billion and is expected to grow at an 8.3% CAGR, reaching USD 143.9 billion by 2030.
- Globally, 20.5% of people use voice search, with 27% of these searches conducted on mobile devices.
- Local searches constitute 46% of all Google queries.
- Mobile devices are responsible for about 62% of worldwide site traffic.
- Websites that load in just one second achieve conversion rates five times higher than those that take 10 seconds to load.
- Nearly 83% of marketers believe that AI will positively impact website optimization.
Digital Marketing Statistics
Digital marketing continues to evolve rapidly, reshaping how businesses connect with audiences. Staying informed is essential for effective strategy development.
Check out these digital marketing statistics below:
- The digital advertising and marketing market worldwide is projected to reach $1.1 trillion by 2030, up from $532.2 billion in 2023.
- Search advertising remains the largest segment, with spending projected at $351.55bn in 2025.
- Mobile ad spending in the U.S. was estimated at $228 billion in 2025.
- Google processes approximately 16.4 billion searches each day, dominating 89.62% of the global search engine market share.
- Facebook and Google Ads are reported to have the highest ROI among paid advertising channels.
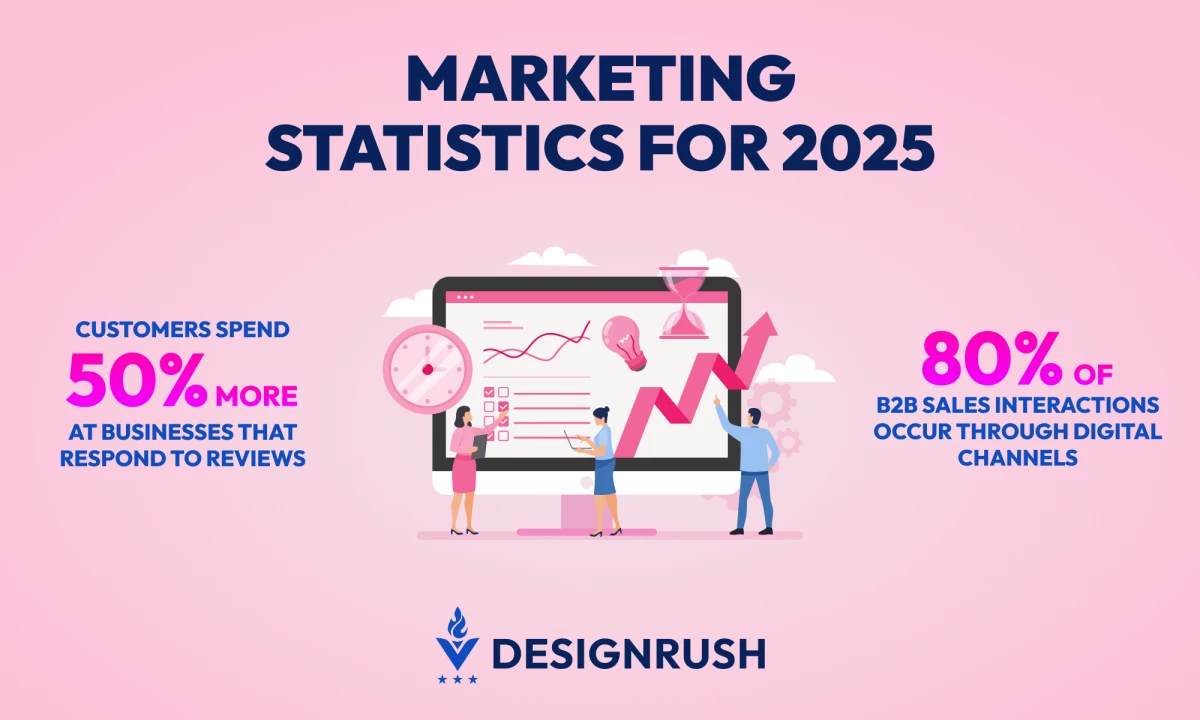
- Businesses that respond to reviews can see customers spend 50% more. (DemandSage)
Content Statistics
The content marketing landscape is evolving rapidly, driven by changing consumer preferences and technological advancements. Businesses that prioritize high-quality, engaging content are seeing significant growth and stronger customer relationships.
The following content marketing statistics reveal the latest trends shaping content strategies in the past few years.
- The content marketing industry is projected to be worth $107 billion in 2026.
- Nearly one-third (33%) of B2B content marketers plan to increase their content marketing budgets by 1–9% in 2025
- By 2025, 67% of small business owners and marketers will use AI for content marketing and SEO.
- 58% of B2B marketers reported that content marketing boosted their sales and revenue. (DemandSage)
- In 2025, video content is projected to comprise 82.5% of global internet traffic. Additionally, 91% of marketers have integrated video content into their strategies.
- Approximately 85% of businesses were expected to invest more in video content in 2025. (DemandSage)
- In 2025, 55% of Americans listened to podcast content at least once a month.
- By 2025, podcast ad spending in the U.S. is expected to reach $2.38 billion, an 18.52% increase from 2023.
- 83% of consumers wanted to see more video content from their favorite brands.
Pay-Per-Click Statistics
Pay-per-click (PPC) advertising continues to be a pivotal component of digital marketing strategies, offering businesses immediate visibility and measurable results. As the digital landscape evolves, staying up-to-date about the latest PPC trends is essential for maximizing return on investment.
Below are the top PPC statistics that highlight the current state and future projections of this dynamic advertising channel.
- According to Google, businesses typically earn $2 in revenue for every $1 spent on Google Ads, resulting in a 200% return on investment (ROI)
- The average click-through rate (CTR) for search ads across all industries is 3.52%.
- Around 50% of ad spending is concentrated on Google and Facebook.
- Approximately 41% of all clicks go to the top three paid ads in search results.
- Search ads on Google have an average cost per click of $4.66.
- 45% of small businesses utilize PPC advertising.
Social Media Statistics
Social media continues to transform how individuals connect, share, and engage online. Knowing about the newest trends is crucial for businesses aiming to effectively reach their audiences.
Here are the top social media statistics that highlight the current landscape.
- The social media market worldwide expanded to $286.53 billion in 2025.
- Facebook remains the world’s most-used social media platform, with 3 billion monthly users.
- In 2023, the average daily time that people spend using social networks was 2 hours and 24 minutes.
- Instagram is projected to account for more than half of Meta’s U.S. ad revenue in 2025.
- 90% of social media users follow at least one brand, indicating strong consumer interest in brand engagement.
- On average, users worldwide spend 95 minutes per day on TikTok, surpassing time spent on other social media platforms.
Sales Statistics
Sales trends are changing faster than ever. Companies need to stay on track regarding changes to remain competitive and improve outcomes.
Below are key sales statistics offering insights into the evolving sales landscape.
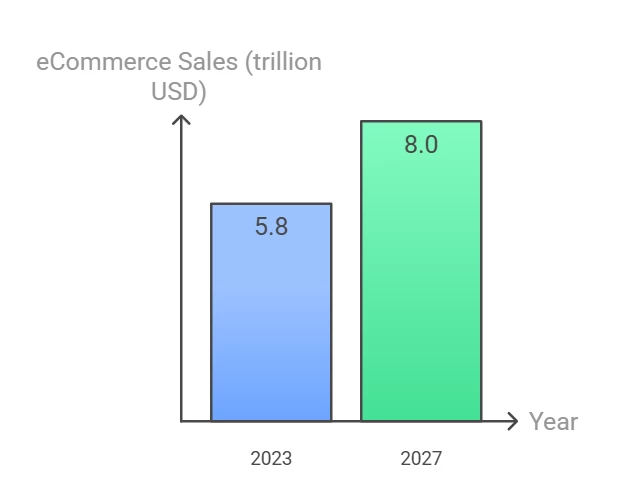
- Global retail eCommerce sales were estimated at $5.8 trillion in 2023, with projections forecasting a 39% increase to exceed $8 trillion by 2027.
- Global eCommerce sales are projected to reach $4.3 trillion in 2025 and grow further to nearly $8 trillion by 2027.
- The average annual income for sales professionals is recorded at $75,788, with additional earnings from commissions averaging $11,300.
- In 2025, 80% of B2B sales interactions between suppliers and buyers will occur through digital channels.
- U.S. retail sales are expected to reach $7.9 trillion by 2026, rising from approximately $6.6 trillion in 2021.
Email Marketing Statistics
Email marketing remains a cornerstone of digital communication, offering unparalleled reach and engagement opportunities. With billions of users worldwide, its effectiveness continues to grow, making it indispensable for businesses.
Take a look at the top email marketing statistics below.
- The email user base worldwide is expected to hit 4.6 billion by 2025, up from 4 billion in 2023.
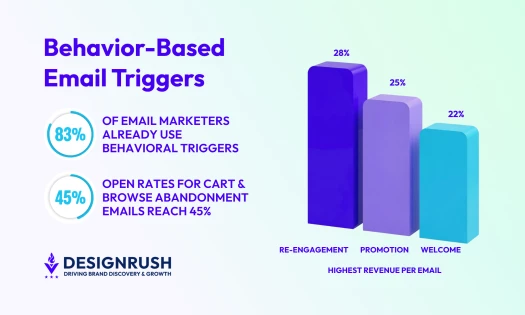
- Email marketing has an overall ROI of 4,200%, meaning businesses can earn $42 for every dollar spent. Additionally, mobile devices account for 60% of email opens.
- 78% of marketers say that subscriber segmentation is the most effective email marketing strategy.
- Personalized emails have higher open rates of 44.30%. Additionally, welcome emails achieve an impressive average open rate of 83.63%.
- Emails featuring preheader text achieve an average open rate of 44.67%, compared to 39.28% for those without it. (GetResponse)
- The average email open rate is 29.49%, and the average click-through rate is nearly 3%.
Video Statistics
Video content has become a dominant force in digital marketing, capturing audience attention and driving engagement across platforms. Its versatility and effectiveness make it a crucial component of modern marketing strategies.
Consider these key video marketing statistics below.
- 89% of marketers include video content as a core part of their marketing plans.
- More than half (52%) of B2B marketers consider video the most effective content type for generating the highest ROI.
- Explainer videos are used by 73% of video marketers, making them the most popular format. (Wyzowl)
- Spending on video advertising is projected to reach US$207.52bn in 2025.
- 78% of consumers rely on short-form videos for product research. (Wyzowl)
- Videos influence 82% of people when making purchase decisions. (DemandSage)
- 36% of marketers allocated funds specifically to video ads this year. (Wyzowl)
Web Design Statistics
Effective web design is vital for capturing user attention and driving engagement. A well-designed website enhances user experience and significantly impacts a company’s credibility and conversion rates.
Here are the top web design statistics that highlight current trends and insights.
- The average yearly salary for web designers in the United States is approximately $70,000.
- Employment of web developers and designers in the U.S. is projected to grow by 8% from 2023 to 2033.
- Web design services in the U.S. are valued at $43.5 billion, reflecting the industry’s significant economic impact.
- It will only take 0.05 seconds for a visitor to have an opinion about a website, which highlights the need for immediate visual appeal.
- The global web development market was valued at is expected to reach USD 141.49 billion by 2033, growing at a CAGR of 8.03% from 2025 to 2033.
Influencer Statistics
Influencer marketing has become a crucial part of modern digital strategies, enabling brands to connect authentically with target audiences. Its rapid growth underscores its effectiveness in driving engagement and conversions.
- Since 2020, the global influencer marketing market has more than tripled, with projections for 2025 estimating its value to hit a record of around 33 billion U.S. dollars.
- The global influencer marketing platform market is expected to grow from USD 23.60 billion in 2025 to USD 71.04 billion by 2032.
- In the U.S., influencer marketing spending rose 16% year-over-year to over $8.14 billion in 2024, outpacing social ad spending growth. It is expected to increase further in 2025.
Marketing Stats Takeaways
These statistics highlight the growing importance of authentic partnerships and strategic collaboration in achieving marketing goals. Businesses seeking to stay competitive must adapt to these trends and harness the potential of influencers in their marketing campaigns.
Explore these insights further and integrate them into your strategies to unlock new opportunities for growth and engagement.