The global PPC market is booming, and businesses can’t afford to waste ad spend on ineffective strategies. Discover how optimizing PPC reporting can streamline operations and drive major business outcomes in today’s digital landscape.
PPC Reporting: Key Points
- Automating PPC reporting can reduce reporting time by up to 70%, freeing up resources for more strategic tasks.
- Metrics like Customer Acquisition Cost (CAC) and Lifetime Value (LTV) in executive reports directly tie marketing performance to business growth, helping secure executive buy-in.
- Customizing PPC reports based on industry needs helps ensure reports resonate with the unique goals of each sector.
PPC Reporting Overview
We discuss the KPIs to focus on and how to create effective PPC reports that drive strategic decisions and improve campaign outcomes.
The Value of Optimizing PPC Reporting for Maximum Impact
As the global pay-per-click (PPC) market continues its rapid expansion, brands are increasing their investment in paid search to stay competitive.
Worldwide spending on search ads is projected to reach $351.55 billion by 2025, reflecting both the growing demand for visibility and the increasing importance of effective digital advertising.
As brands strive to secure their position in the digital marketplace, the ability to track and optimize ad spend becomes a key differentiator.
For business leaders and marketers, the value of optimized PPC tracking and reporting cannot be overstated. Here's why it’s essential to sustaining and accelerating growth:
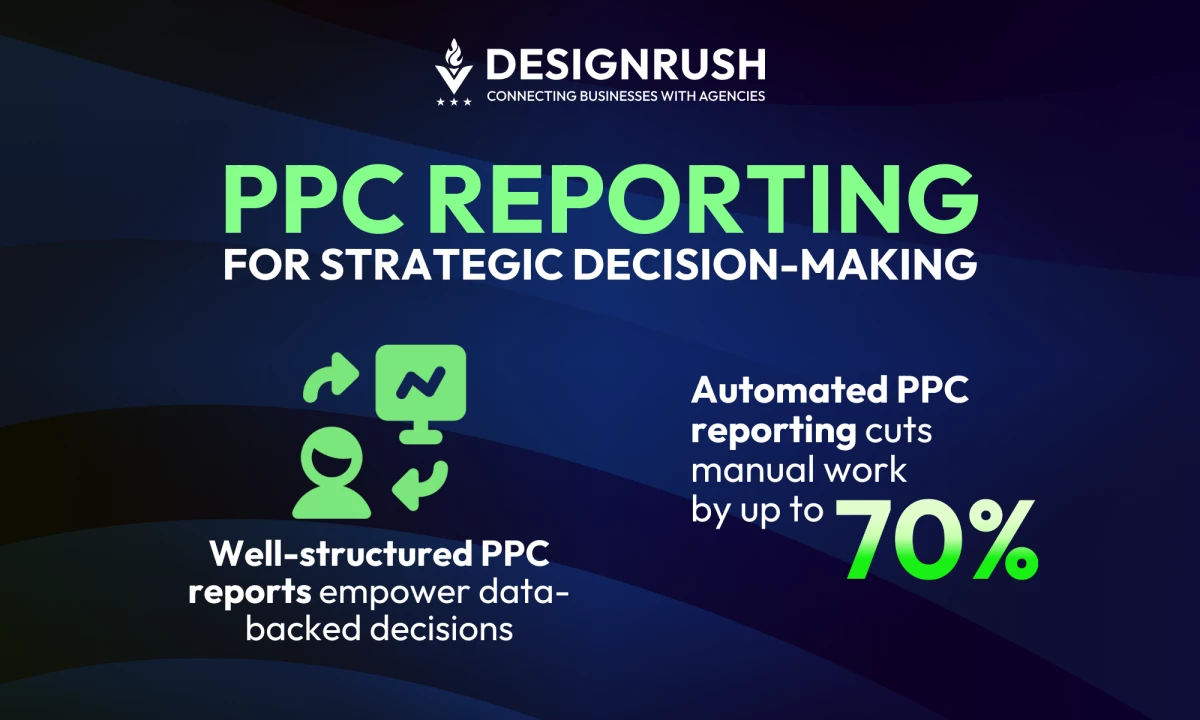
- Informs strategic decisions: Well-structured PPC reports provide insights directly linked to revenue and business goals, enabling leadership to make data-driven decisions.
- Drives operational efficiency: Automating PPC reporting can reduce time spent by up to 70%, allowing teams to focus on higher-value tasks and boosting productivity.
- Boosts trust: By aligning PPC performance with business outcomes, reports help build trust and demonstrate the direct value of investments.
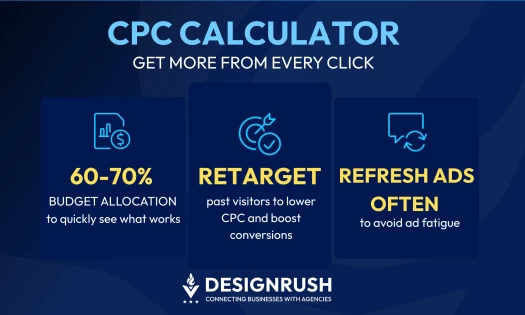
Pro Tip: Think of your PPC report as more than just a scorecard. Instead, it's your monthly re-pitch to your client or leadership team, proving that their investment is paying off and reinforcing your strategic value.
Executive-Level Metrics That Make PPC Reports Boardroom-Ready
Not all metrics are equal in the eyes of a CEO or CFO. It’s important to tailor reports to include the KPIs that matter for executive decision-making, while still tracking foundational metrics for campaign health.
Here’s how to balance them all:
Foundational Metrics
These metrics are the bread-and-butter for campaign managers and useful for weekly optimization reports:
- Click-through rate (CTR): Measures the percentage of users who click an ad after seeing it.
- Cost per click (CPC): Calculates the average cost paid for each click on an ad.
- Conversion rate (CVR): Tracks the percentage of visitors who complete a desired action (e.g., purchase, sign-up).
- Return on ad spend (ROAS): Evaluates the revenue generated for every dollar spent on ads.
- Impression share: Indicates the percentage of impressions your ads received compared to total possible impressions.
These indicators show how well ads and keywords are performing tactically. They are invaluable for the day-to-day or week-to-week adjustments (bids, creative tweaks, keyword refinements).
Strategic KPIs for Decision-Makers
These are the metrics that make executives sit up and take notice, and thus should feature in monthly/quarterly executive reports, often with visualizations for the C-suite and revenue team:
- Customer acquisition cost (CAC): Measures how much is spent to acquire each customer. This directly ties marketing spend to a cost per customer, which finance teams love for modeling budgets and cash flow.
- LTV-to-CAC ratio: Compares the lifetime value of a customer to the cost of acquiring them. This translates marketing performance into investor language (return on capital).
- Cost per qualified lead (CPQL): Executives care more about qualified leads, or those that meet sales criteria and have a higher likelihood of converting. This metric focuses on quality over quantity.
- Revenue or pipeline attribution by campaign: This shows how much revenue each campaign or channel has generated. A CEO would rather hear, “Campaign X drove $50,000 in sales this month” than “Campaign X has a 5% conversion rate.”
- Branded vs. non-branded ROI: Compares the ROI of branded versus non-branded campaigns, helping executives understand the impact of both capturing existing demand and generating new business.
As one agency CEO noted, the boardroom conversation changes when you switch from talking about click rates to talking about contribution margin and customer value. By including metrics like CAC, LTV, and revenue impact, you’re speaking the CFO’s language.
Metrics by Industry Use Case
Certain industries will emphasize specific reporting metrics. A savvy marketing team customizes reports accordingly:
- eCommerce: ROAS, average order value (AOV), cart abandonment rate show ad efficiency and checkout funnel health for online retailers.
- SaaS: CAC, marketing qualified leads to sales qualified leads (MQL-to-SQL) conversion rate, user retention/churn focus on cost per customer and funnel conversion, plus how PPC leads to subscribers who stick around.
- Local services: Phone call tracking conversions, cost per appointment, geo-targeted ROI measure how ads drive inquiries or visits in specific areas.
Each industry has its own “north star” metrics. For example, a SaaS CEO is highly sensitive to LTV:CAC and churn rate. A detailed PPC report should highlight how paid campaigns are delivering trial signups or demos that convert to paying users.
On the other hand, a local home services business should focus on phone calls and booked jobs. So, integrating call tracking data or Google My Business insights can make the report far more relevant.
Effective PPC Reporting for Better Business Outcomes
Your ability to turn PPC data into actionable strategies ensures that your reporting resonates with C-suite executives. By optimizing the alignment of your reports, setting clear objectives, and forecasting future trends, you can move beyond simple metrics to powering long-term business growth.
- Strategic objective mapping
- Funnel-centric reporting
- Forecast & budget alignment
- CRM & attribution data integration
- Cross-channel reporting
- Opportunities for optimization
1. Strategic Objective Mapping
To make your PPC reporting actionable, start by linking each metric to the specific goals your leadership team cares about. Here’s how to approach this:
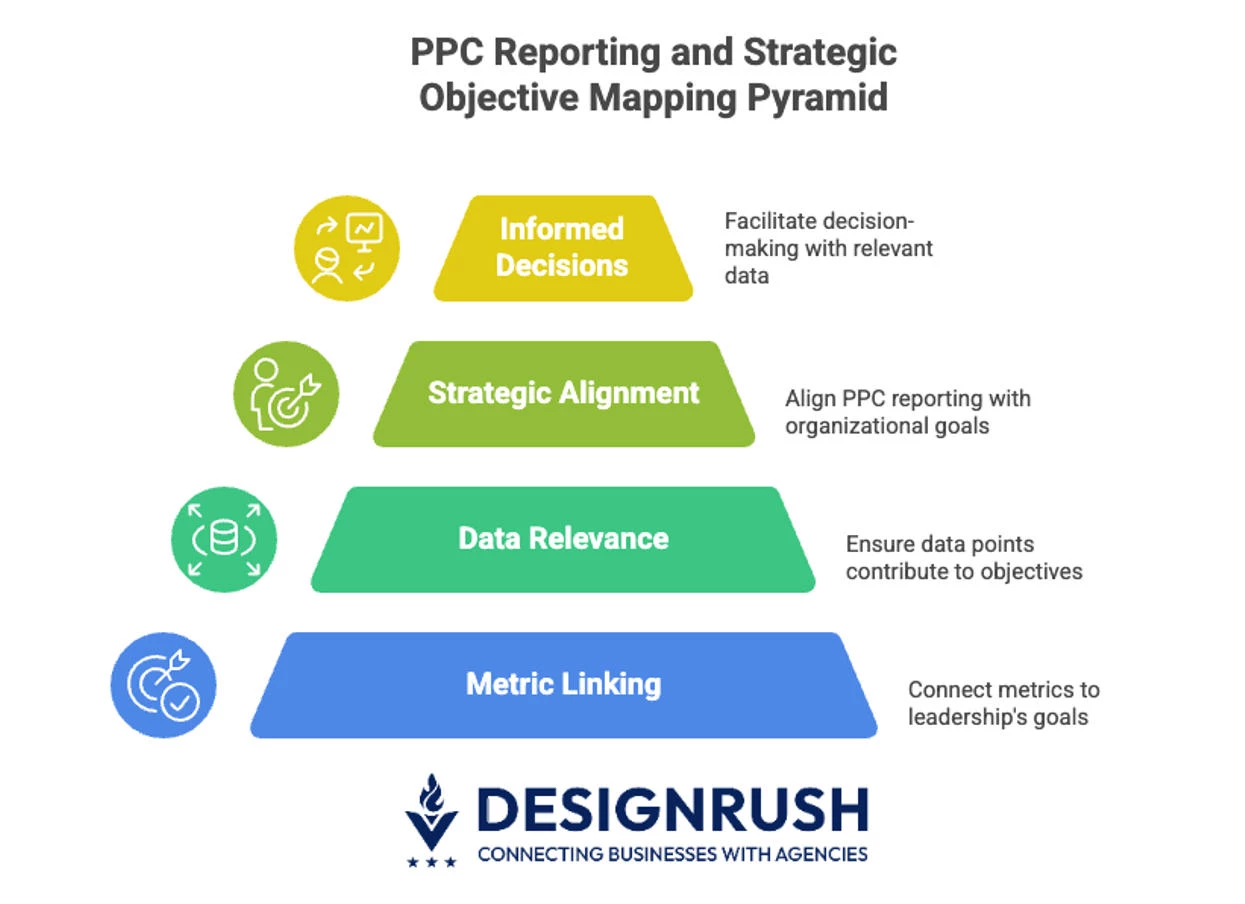
- Brand awareness: Use metrics like reach, impressions, and cost per mille (CPM) to show how many people your ads are reaching and at what frequency.
- Example: Campaign X reached 150,000 unique users at an average frequency of 2.1, creating initial brand awareness at $5 CPM.
- Lead generation: Highlight CPA, CPQL, and conversion rates on key landing pages.
- Example: PPC efforts generated 500 leads, 100 of which became sales-qualified opportunities.
- Revenue growth: If revenue is the key business objective, prioritize ROAS, total revenue, and ROI. Show how PPC contributes to bottom-line growth.
- Example: Our paid search campaigns generated $200K in revenue at a 5:1 ROAS, making a direct impact on sales.
You can label sections of your report like “Goal: Increase Brand Visibility” and then show the numbers. Also provide insight like “Recommendation: Our CPM is above industry benchmarks. We will optimize creative to improve relevance and lower cost per impression.”
2. Funnel-Centric Reporting
Breaking down your PPC results by stages of the marketing funnel gives you a clear view of how PPC is guiding leads toward conversion. It’s essential to present this data clearly to business leaders to show the full customer journey.
Here’s how you can demonstrate how your PPC efforts move prospects through each stage of the funnel:
- TOFU (Top of Funnel): Metrics like impressions, reach, and video views demonstrate how your ads are building awareness.
- Example: YouTube ads generated 50,000 views at a $0.02 CPV, successfully attracting new leads to the top of the funnel.
- MOFU (Middle of Funnel): Highlight engagement metrics such as time on site, conversion rate on lead magnets, or the number of leads generated.
- Example: New landing page converted 8.5% of visitors to sign-ups, showing improved mid-funnel performance from the previous month.
- BOFU (Bottom of Funnel): Focus on conversions, CPA, and ROI to demonstrate how PPC is closing sales or generating high-quality leads.
- Example: Remarketing ads drove 30 purchases at a $20 CPA, contributing $15K in revenue with a 5:1 ROAS.
This structure shows the full journey and where potential bottlenecks are. If, say, TOFU metrics look great (lots of clicks), but BOFU outcomes are lagging (few sales), that sets up a strategic conversation.
Maybe the issue is post-click (e.g., the website or sales process needs work), not the ads themselves. This approach makes your PPC report a diagnostic tool for the whole marketing funnel.
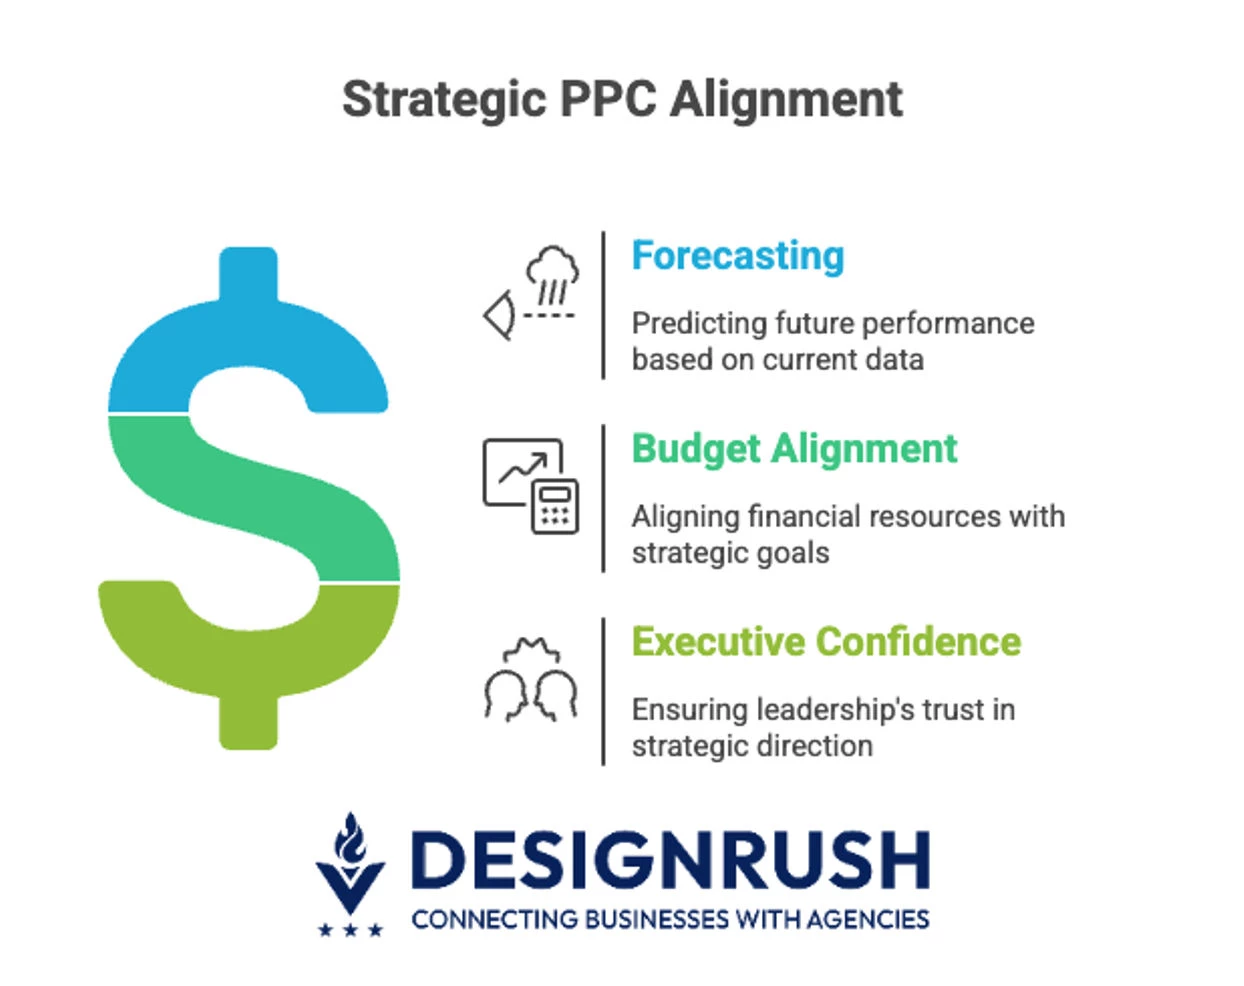
3. Forecast & Budget Alignment
One of the most effective ways to leverage PPC reports into strategic conversation is by forecasting future performance based on current data. This helps executives align expectations with achievable goals.
Here are elements that provide executives an actionable path forward and enable proactive budget and strategy adjustments:
- Revenue forecasts: Present future projections based on current trends. Use data-driven insights to show what could be achieved with adjusted strategies or budgets.
- Example: Based on current trends, we’re on track to generate $500K in revenue from PPC by Q3, but a 15% increase in spend could drive an additional 10% in conversions.
- Budget adjustments: Forecast how a potential budget increase or shift in strategy will impact outcomes. Frame budget decisions in terms of return.
- Example: Increasing spend by 15% is expected to bring 50 additional sales, based on our current conversion rates.
Predictive reporting gives executives confidence that you’re steering the ship toward future goals. Modern PPC tools use AI to suggest budget optimizations — you can incorporate those, but always with your own analysis.
4. CRM & Attribution Data Integration
Integrating customer relationship management (CRM) and attribution data takes your PPC reporting to the next level. It helps business leaders see how PPC contributes to the sales pipeline, beyond just clicks and conversions.
Dan Sava, founder of performance media agency Neon Growth, emphasizes the importance of accurate attribution:
“Having attribution and modeling you can trust is critical to setting an effective multi-channel strategy. All of your channels need to be operating on the same parameters for attribution.
But there are also nuances, for example, you can’t base your entire strategy on the last click and ignore view-through, otherwise, you’ll be led to under-invest in valuable upper funnel channels.”
Here’s how you can provide a comprehensive view of how PPC is impacting real business outcomes:
- Link ads to sales: Use urchin tracking modules (UTMs) to connect ad interactions to sales or leads. By incorporating CRM data, you can report on metrics like revenue generated from PPC or deals won from paid search.
- Example: Our Google Ads campaign generated 120 leads, of which 30 became sales opportunities, and 10 closed deals worth $80,000 in revenue.
- Segment your data: If you serve different segments or products, break down your PPC results by category. This allows executives to see which segments or products are driving the most value.
- Example: Campaign A generated 50 small business leads at $100 CPA, while Campaign B generated 20 enterprise leads at $300 CPA, acceptable due to higher deal sizes.
- Integrate your CRM for lifecycle reporting: Show cost per opportunity, opportunity-to-sale rate, or revenue per lead to demonstrate PPC’s impact beyond the initial conversion.
- Example: Our remarketing campaign generated 50 leads at $150 CPA, with 40% converting to sales opportunities and 25% in closed leads, resulting in $200,000 total value.
Integrating CRM data requires setup and good data hygiene. But the payoff is huge: your PPC report leads to higher-level conversations like how to scale what’s bringing in the most revenue, or how to adjust marketing-qualified lead criteria.
5. Cross-channel Reporting
By combining PPC performance with data from SEO, social media, content marketing, and even email campaigns, you can provide a more complete picture of how your marketing ecosystem is performing.
- SEO: By comparing the performance of organic and paid search results, you can identify opportunities to optimize both channels.
- Example: Our top-performing keyword generated 500 organic visits and 300 PPC clicks. Combined, these brought in 800 visits, with a 25% conversion rate.
- Social media: Understand how your paid ads and social media campaigns complement each other. You can measure how ads influence engagement and how social media drives conversions.
- Example: A Facebook ad campaign drove 1,000 clicks to our site, of which 200 came from users who had previously engaged with our Instagram posts.
- Content marketing: Use data from blog posts, videos, or whitepapers alongside PPC metrics to show how content marketing fuels awareness.
- Example: Our content marketing campaign generated 300 views of a new blog post, leading to 50 clicks on our PPC ad. This resulted in 10 new sales, showing the synergistic effect between content and paid search.
6. Opportunities for Optimization
In every PPC campaign, some elements will underperform. The key to successful reporting is framing these challenges as opportunities rather than simply pointing out flaws.
Here’s how you can focus on continuous improvement:
- Identify the problem: Rather than merely noting underperformance, explain what’s causing it and propose an actionable solution.
- Example: CTR dropped by 11% this month due to ad fatigue. We plan to launch three new headline variants to improve engagement.
- Propose solutions: When reporting underperformance, always offer a clear next step that shows your commitment to optimization and continuous improvement.
- Example: Mobile ROAS is 30% lower than desktop. We’ll optimize mobile landing page load speed to boost conversion.
- Emphasize proactive response: Report that you’re on top of it and optimize spending by reallocating resources to more effective strategies.
- Example: Display ads produced fewer conversions than expected. To address this, we’re reallocating the budget to remarketing, which converts at 2x the rate.
By doing this, you preempt questions like “Why did this drop?” or “What are you doing about it?” Executives generally understand that not all metrics will go up every period; what they want to see is agility and problem-solving.
Evaluating the Best PPC Reporting Tools for Your Business
With dozens of PPC tools on the market, choosing the right one comes down to your agency’s size, workflow, and integration needs.
Below is a list of popular PPC reporting options and their best-use scenarios:
| Tool | Best For | Key Strengths |
| Google Looker Studio | Freelancers & small agencies | Flexible dashboards, native Google Ads integration |
| Supermetrics | Mid-sized, data-driven teams | Automated data pipelines |
| DashThis | Agencies needing client-ready reports (white-label) | Turnkey client-facing templates |
| Funnel.io | Teams with omni-channel scope | Centralizes data from 500+ sources |
| Improvado | Enterprise-level integrations | Advanced ETL features and customizable schemas |
| Tableau | Large teams needing complex analysis | Enterprise-grade data visualization and deep analytics |
Pro Tip: The value of a reporting tool lies in the insights it provides, not just the data it displays. Even the most advanced dashboards won’t be useful if they don’t deliver clear, actionable insights.
Choose tools that streamline your data analysis, allowing you to focus on strategy rather than manual data compilation.
AI and Automation: The Future of PPC Reporting
Understanding the power of AI and automation in PPC is key to optimizing ad spend and predicting trends in an increasingly complex digital landscape.
- Optimized ad spend: Automation tools like Google Smart Bidding ensure that every dollar spent is going toward the most profitable clicks, adjusting bids in real time based on performance indicators.
- Scalability and customization: AI-powered platforms make scaling easier by automating bidding, report generation, and performance tracking. These tools can be customized to focus on the most critical KPIs, enabling a more personalized and strategic approach.
- Enhanced decision-making: PPC AI tools can automatically flag underperforming ads, suggest alternative strategies, and highlight profitable trends. Real-time data processing ensures you can pivot quickly based on the most current and comprehensive insights.
- Competitive intelligence: By analyzing competitor strategies, you can adjust your PPC campaigns in real time so you can maintain success in your industry.
PPC Reporting: Final Thoughts
Effective PPC reporting is crucial for translating complex data into actionable insights that align with business objectives. By adopting strategic, automated, and tailored reporting practices, you can optimize ad spend and strengthen your position in a crowded marketplace.
![]()
Our team ranks agencies worldwide to help you find a qualified partner. Visit our Agency Directory for the top PPC companies, as well as:
- Top Advertising Agencies
- Top Conversion Rate Optimization Agencies
- Top B2B PPC Agencies
- Top Media Buying Agencies
- Top SEO Agencies
PPC Reporting FAQs
1. What should a strategic PPC report include for executive audiences?
A strategic PPC report for executives should focus on high-level metrics that directly impact business outcomes, such as Customer Acquisition Cost (CAC), Return on Ad Spend (ROAS), Revenue Attribution, and LTV-to-CAC ratio.
It should highlight key business goals like lead generation, revenue growth, and ROI. Provide a concise executive summary with clear insights and actionable recommendations, avoiding granular details. Visuals like sparklines, charts, and KPIs make the data more digestible.
2. How often should PPC reports be delivered?
PPC reports should be delivered monthly for high-level strategy reviews and performance analysis with executives. Weekly or bi-weekly updates are ideal for tactical adjustments and ongoing campaign optimizations, especially for teams directly managing campaigns. This ensures ongoing communication and quick adaptation to performance trends.