To understand what is actually working in social media marketing, we surveyed marketing experts from agencies, brands, in-house teams, and consultancies.
Most respondents work in lean teams across services, agency, SaaS, and tech businesses serving North American and global markets.
Since these are the people managing social media day to day, their answers reflect what gets planned, published, measured, and improved in real campaigns.
Social Media Marketing Stats: Key Findings
- The biggest finding is the gap between belief and measurement. 90% believe social media contributes to revenue, but only 35% can clearly prove it.
- Leads and sales now matter more than clicks. 55% prioritize business outcomes, while click-throughs sit at only 8%.
- Likes have lost value as a performance signal. Leads or purchases rank highest at 40%, while likes rank last at 2%.
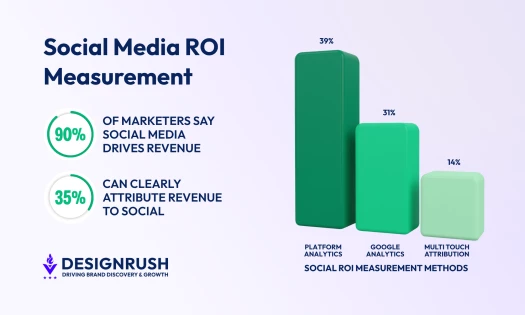
90% Believe Social Media Marketing Drives Revenue but Only 35% Can Prove It
 The social media statistics reveal a clear business risk, with social media earning confidence faster than teams are building the measurement systems to defend it:
- 66% of respondents are very confident social media contributes to revenue/business results, and another 24% are somewhat confident, which amounts to 90% confident in total.
- When asked whether they can reliably connect social media to revenue, only 35% said they can do so clearly.
- Another 50% said they can connect it only partially, while 14% said they cannot reliably prove the connection.
Nearly everyone believes social drives revenue, but barely a third can demonstrate it.
That's the gap that gets a social budget cut when finance starts asking questions, and it's the strongest argument for fixing attribution before launching another content channel.
Why Platform Analytics Cannot Prove Social’s Full Revenue Role
The measurement methods in use explain a lot:
- 39% rely on platform-native analytics, leaving the platforms to grade their own performance.
- 31% use Google Analytics or UTMs.
- 14% use multi-touch attribution tools.
- 10% connect social performance through CRM attribution.
- 4% depend on manual reporting.
- 1% do not measure consistently.
When 70% of measurement leans on native analytics or last-click UTMs, the things social media marketing actually does well, like assisted discovery, in-platform research, dark social sharing, delayed and cross-device conversions, go unmeasured.

The Metrics That Actually Help Prove ROI
Respondents who can connect social to revenue tend to track signals of intent and downstream value rather than reach: leads generated, assisted conversions, sales influenced, engagement rate, cost per lead, and community growth.
Pairing platform data with CRM and lead data is what moves a team from partially to clearly, and right now only one in ten is doing the CRM piece.
Clicks Are Losing the KPI Fight as 55% Prioritize Leads and Sales
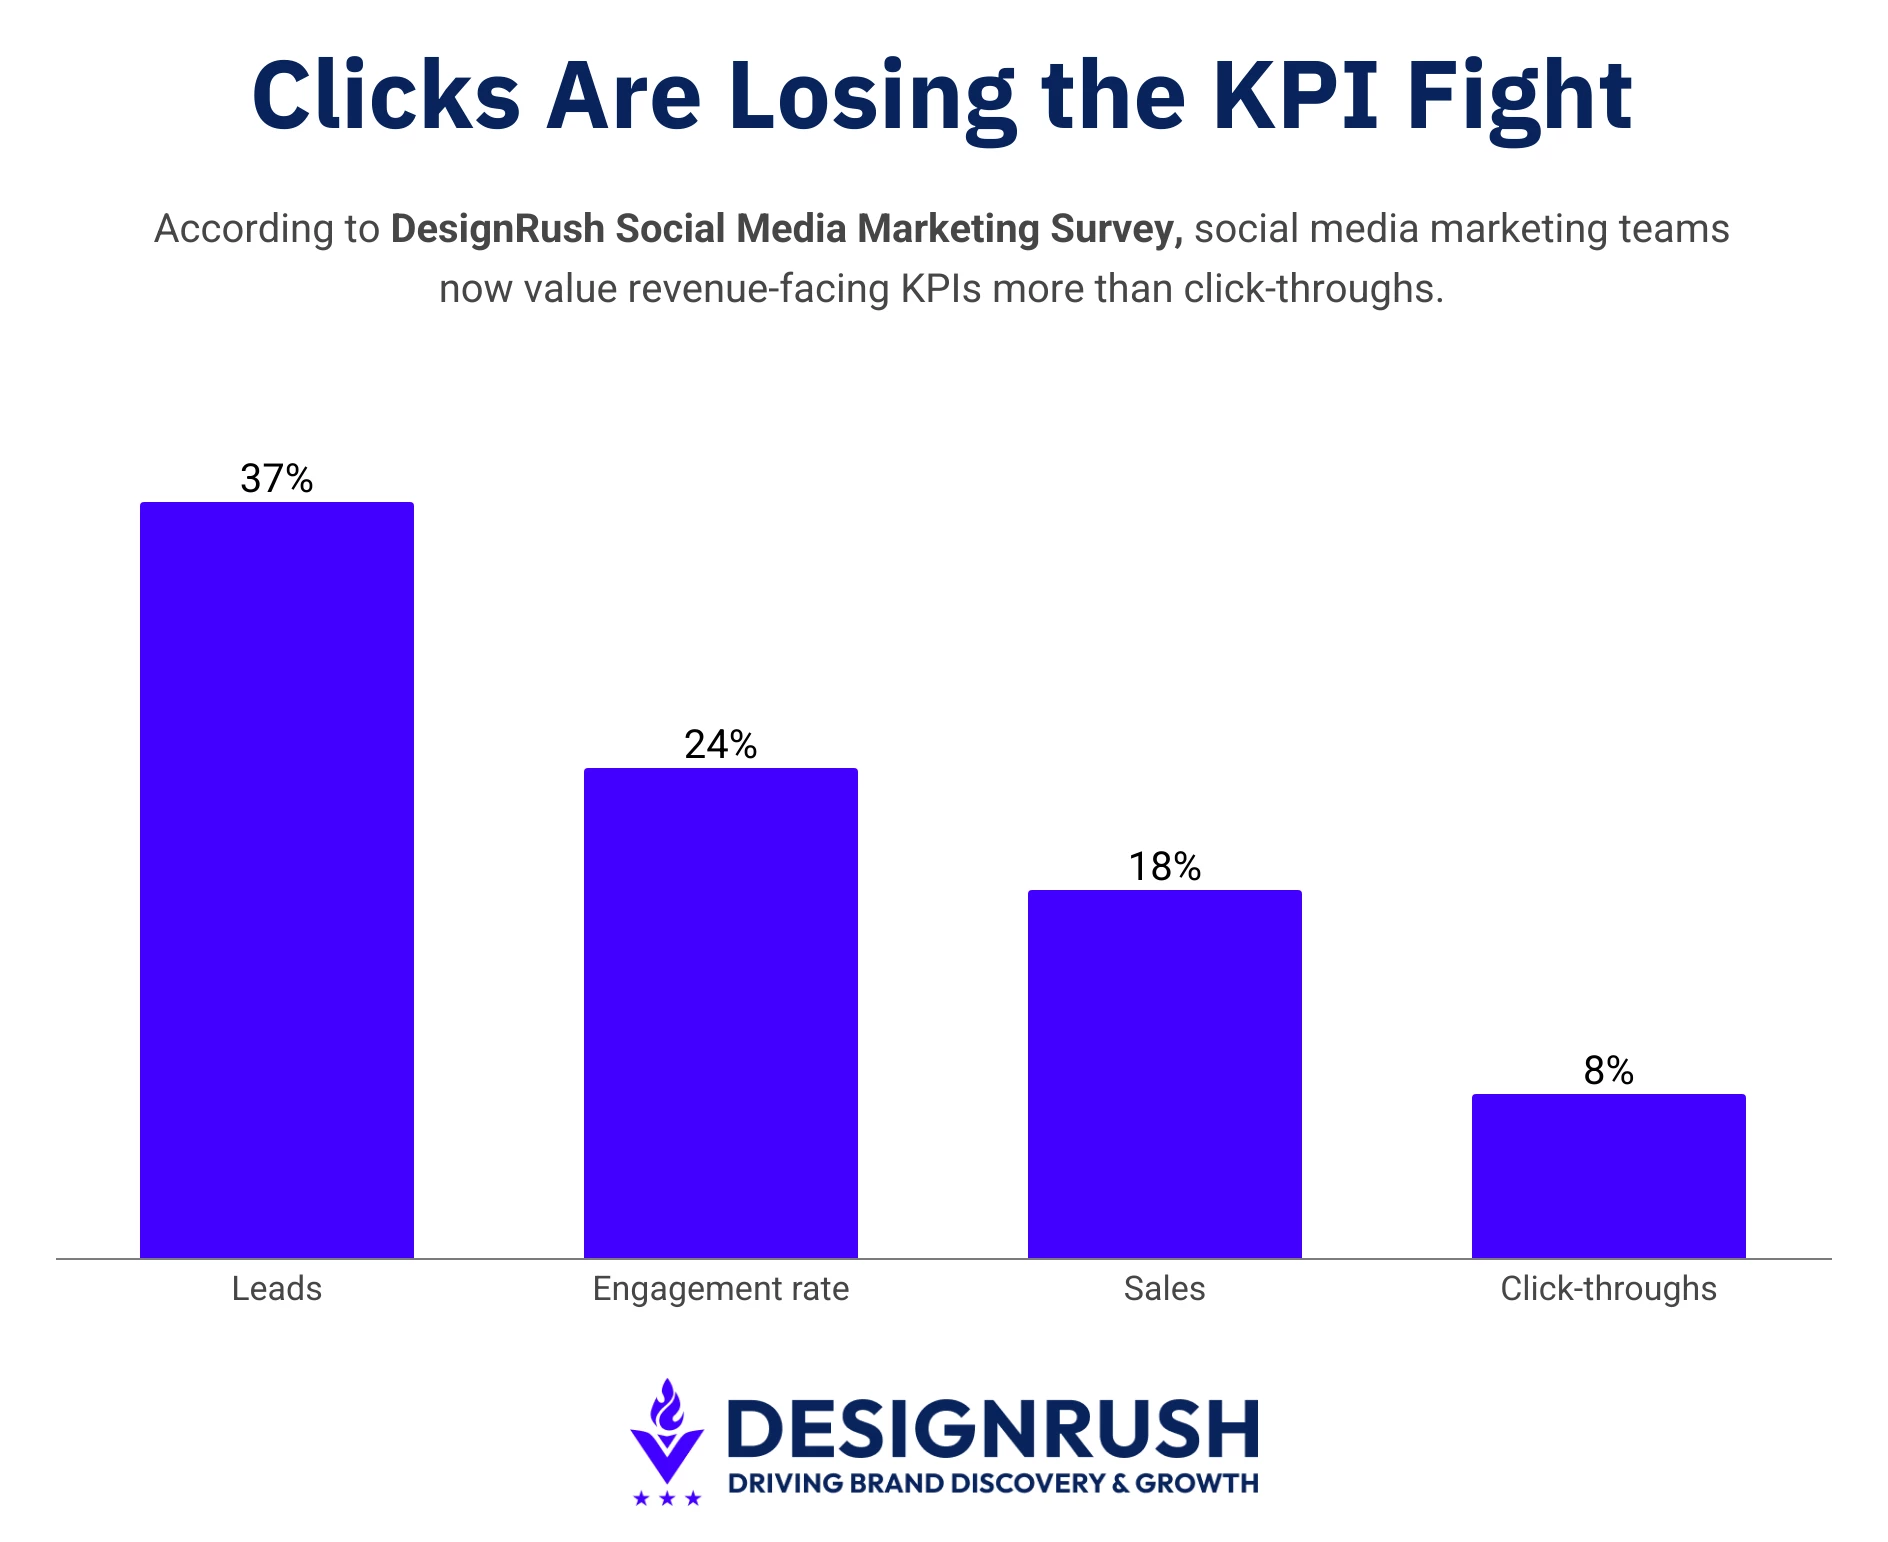 When asked which KPI matters most to their team today, the social media statistics showed a clear shift toward revenue-facing metrics:
- Leads: 37%
- Engagement rate: 24%
- Sales / revenue: 18%
- Click-throughs: 8%
- Reach / impressions: 6%
- Follower growth: 3%
- Saves: 2%
- Shares: 1%
Grouped up, 55% name a business outcome, like leads or sales, as their top KPI, versus just 17% who name a surface metric like reach, followers, or clicks.
Click-throughs sit at 8% for good reason. People research brands without clicking, conversions happen across multiple touches, and in-platform discovery plus dark social make the click an unreliable proxy for intent.
When asked which single metric he would use to judge social success in 2026, Michael Sebastian, Founder & Creative Director at Branded Mayhem Collective, made the intent shift clearer through DMs:
“Inbound DMs. Not because they're the flashiest metric — because they're the only one that proves someone crossed the line from audience to prospect.
Likes are polite. Comments are performative. Shares are generous. But a DM means someone thought about you privately, decided you might solve their problem, and initiated a conversation.
That's demand. Everything else is attention.”
Engagement Quality Beats Raw Engagement
The most valuable engagement metric, per respondents, is leads or purchases (40%), which is far ahead of shares (14%), clicks (11%), comments (10%), and DMs/replies (9%).
Follows (6%), saves (5%), watch time (3%), and likes (2%) round out the bottom.
Likes finished dead last at 2%. The actions teams trust signal intent and distribution: a share, a save, a DM, a meaningful comment.
This matches what respondents read into specific signals: 57% say a share signals high usefulness, and 48% say a save signals high relevance/value, with another 23% reading saves as educational usefulness and 14% as buying intent.
To tighten how your team measures and acts on engagement, see our social media strategy resources.
71% Prioritize Awareness While the Best Social Signals Come From Usefulness
The stated goals lean heavily on reach. Asked for their top two, marketing experts named:
- Brand awareness / reach: 71%
- Lead generation: 70%
- Direct sales / conversions: 23%
- Website traffic: 21%
- Community building: 16%
The rest of the survey suggests that ranking is upside down.
Start with what these same teams say actually breaks brands on social media.
Coded by theme, the most-cited mistake in the open-ended answers was generic, me-focused content for about 23% of responses, followed by chasing trends over substance by 18%, treating social as a one-way broadcast came in around 15%.
 None of those is a reach problem.
They are failures to be useful or distinctive, which is exactly what a reach-first goal tends to crowd out.
Carla dos Santos, founder of The SEO Coach, named the fix in one line: brands lean on "one way comms about themselves," when "socials should build community by offering brand value."
The things they say they care about are relationship and usefulness signals; the things they deprioritize as goals, like community and education, are what produce those signals.
Why Community Deserves More Attention
Community metrics look soft next to leads, which is why only 16% list community building as a top goal.
But repeat engagement, loyalty, advocacy, and reduced reliance on paid reach compound over time.
Sprout Social found 51% of global users plan to spend more time on community-based platforms like Reddit in the coming months, which makes community a discovery channel in its own right.
86% of the surveyed marketing experts run some form of social listening beyond reading comments:
- Content ideas: 29%
- Brand sentiment: 23%
- Competitor monitoring: 21%
On top of that, 88% say it has had some or major impact on results.
 So, the conclusion is that teams are already listening and responding, but most just file it under research rather than community building.
Why LinkedIn, YouTube, and TikTok Behave Like Search Engines
- LinkedIn rewards professional trust and expert content, which is why it dominates discovery for B2B-leaning teams.
- YouTube is built for evergreen, searchable, long-form answers, which is the closest thing social has to a permanent knowledge base.
- TikTok drives quick, trend-led discovery and recommendations, especially for visual and consumer brands.
In practice, write captions and on-screen text around the questions your audience types, build educational content series instead of one-offs, and optimize profiles so the platform's own search surfaces you.
67% of Brands Are Active on the Wrong Platform
The most actionable statistics about social media for budget allocation come from comparing where teams are active against where they get results:
| Platform | Actively market on | Named a top-2 results driver |
| 86% | 60% | |
| 77% | 57% | |
| 67% | 27% | |
| YouTube | 53% | 16% |
| TikTok | 35% | 11% |
| X | 33% | 4% |
| 24% | 5% | |
| 16% | 1% |
LinkedIn and Instagram are the strongest at turning activity into measurable results in this sample.
Facebook, YouTube, TikTok, X, Reddit, and Pinterest show a much wider gap between platform presence and performance, pointing to effort that may not be delivering enough return.
Why Posting Everywhere Can Drain Social Media ROI
Spreading across every platform without the resources to do each one well produces diluted content, inconsistent posting, and measurement no one trusts.
Kitty Lai, Founder & Creative Director at ME BRAND, put the cost plainly: "Being everywhere with a muddled message is often worse than being in fewer places with a sharp one, because it dilutes trust and confuses people about what you actually stand for."
How To Choose the Right Social Media Platforms in 2026
Pick platforms against audience behavior, the buying journey, your content strengths, your sales cycle, and, critically, your internal capacity and measurement maturity.
The active-vs-results split above is a template: audit your own numbers and cut or scale accordingly.
If you need an outside read on where to concentrate effort, compare digital marketing agencies and content marketing agencies.
Short-Form Video Leads at 77%, but Weak Hooks Still Kill Results

The social media stats on format performance show short-form video clearly leading the pack:
- Short-form video (Reels/Shorts/TikTok): 77%
- Carousels: 44%
- User-generated content: 26%
- Static images: 25%
- Long-form video (YouTube): 19%
- Stories: 16%
- Text-only posts: 16%
- Memes / trend-based posts: 7%
- Live video: 2%
Short-form video's dominance lines up with the wider market for video generally.
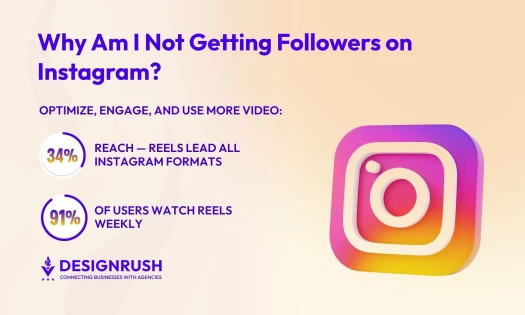
Wyzowl's 2026 survey found that 91% of businesses use video as a marketing tool, and 82% of marketers say it delivers good ROI, down from a 93% peak the prior year, but still a strong majority.
The nuance respondents kept raising: video earns the click, but usefulness and hook strength earn the result.
Elena Peterson, Marketing Director at Big Red Jelly, was direct about it: "AI will not produce the best hooks & content for your brand... You have to learn how to manually craft good hooks and build out a content plan that works for your niche."
Production Style and the Real Bottleneck
- 60% say a mix of polished and lo-fi visuals performs best, versus 19% polished-only and 18% lo-fi-only.
- 86% rate visual quality as critical (46%) or very important (40%).
- The biggest bottleneck in producing visual content is filming (22%), followed by design resources (15%), editing (13%), approvals (12%), and lack of ideas (12%).
High-performing content shares a pattern respondents return to again and again: a clear audience problem, a strong opening, one idea per post, native formatting, and a specific takeaway.
For tools that speed up production without flattening quality, check out the ones we tested and approved.
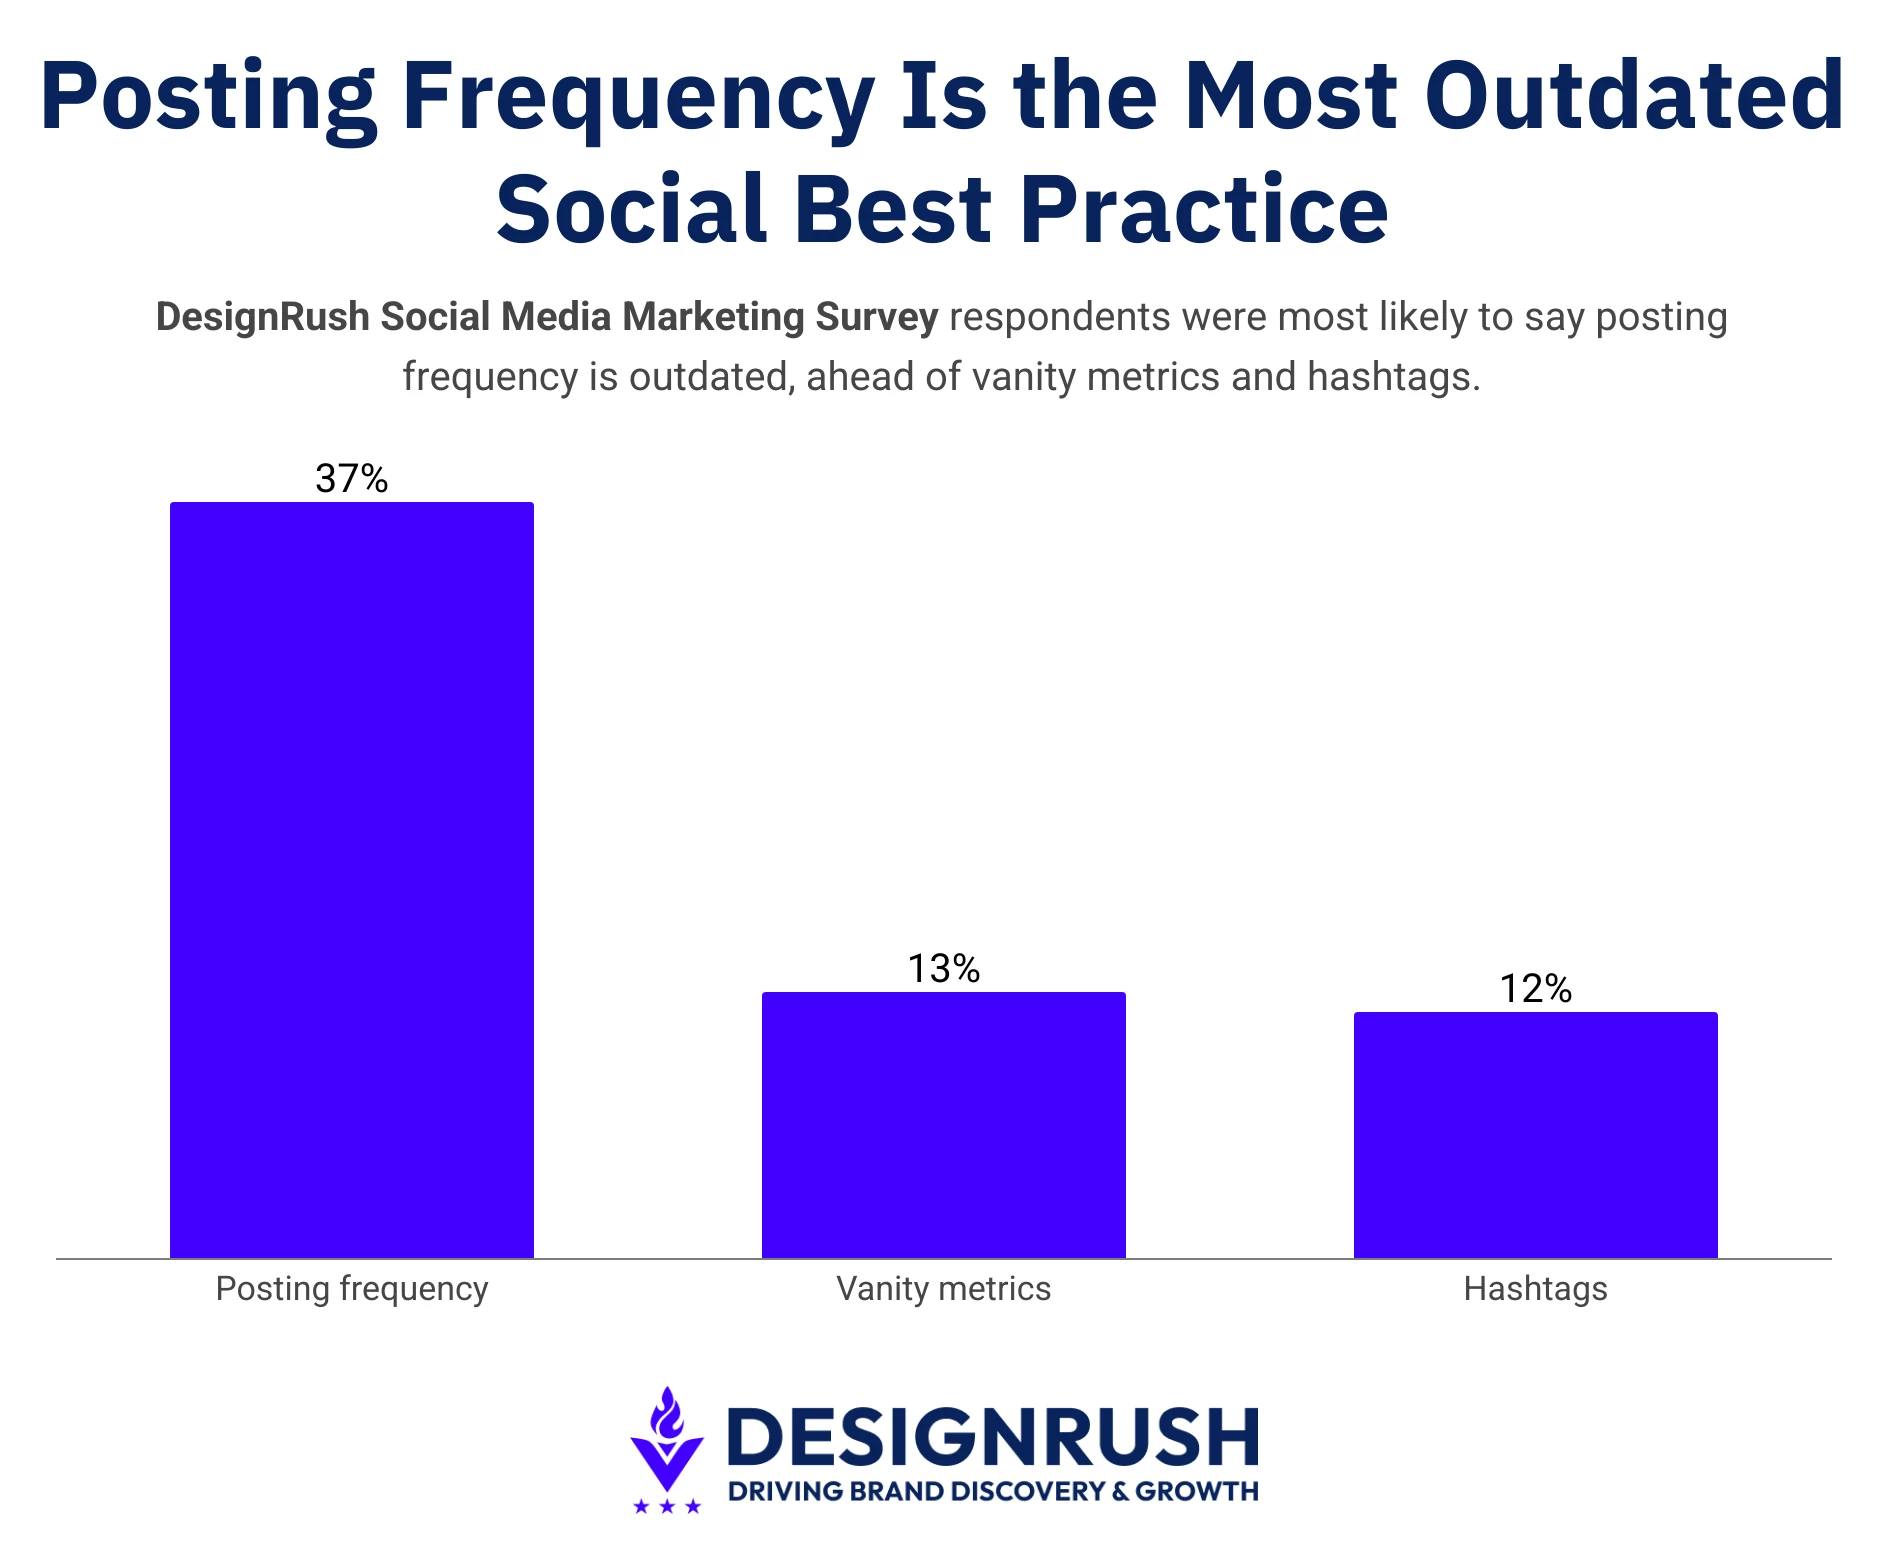
Nearly 40% Say Posting Frequency Is the Most Outdated Best Practice in 2026
Asked which social media best practice they now consider outdated, 37% of respondents named posting frequency, which is, by a wide margin, the top answer.
Follower/vanity metrics (13%) and hashtags (12%) followed.
 The survey data backs up the skepticism.
Only 43% say higher posting frequency produces better engagement, meaning a majority either see no clear pattern (29%), find lower frequency works better (23%), or don't track it (5%).
Most teams post 3-5x per week (52%) on their primary platform, and their number-one frequency constraint is content production time (45%).
Trish Stukbauer, Founder of ie marketing, captured the consensus in her response: "What's working now is restraint. Fewer posts, built with intention — content that earns saves, shares, and real engagement. One strong post will outperform five forgettable ones every time."
Cadence should track capacity and quality instead of a fixed calendar quota. If production time is the constraint, fewer high-intent posts beat more filler.
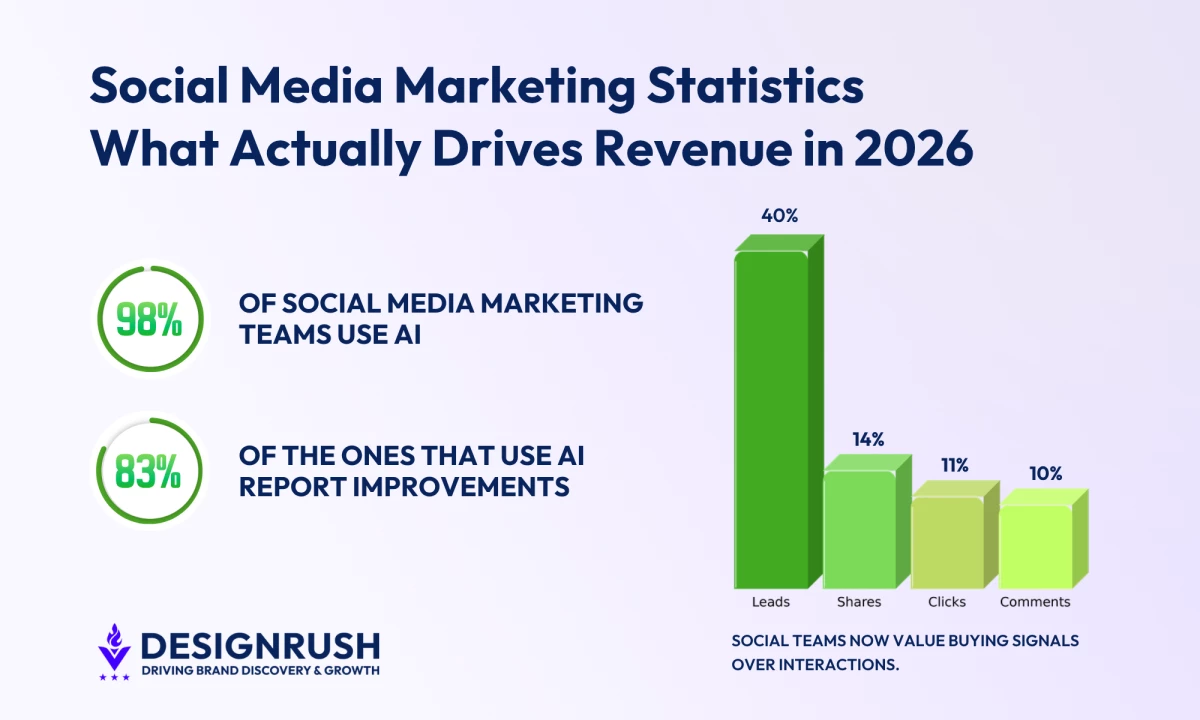
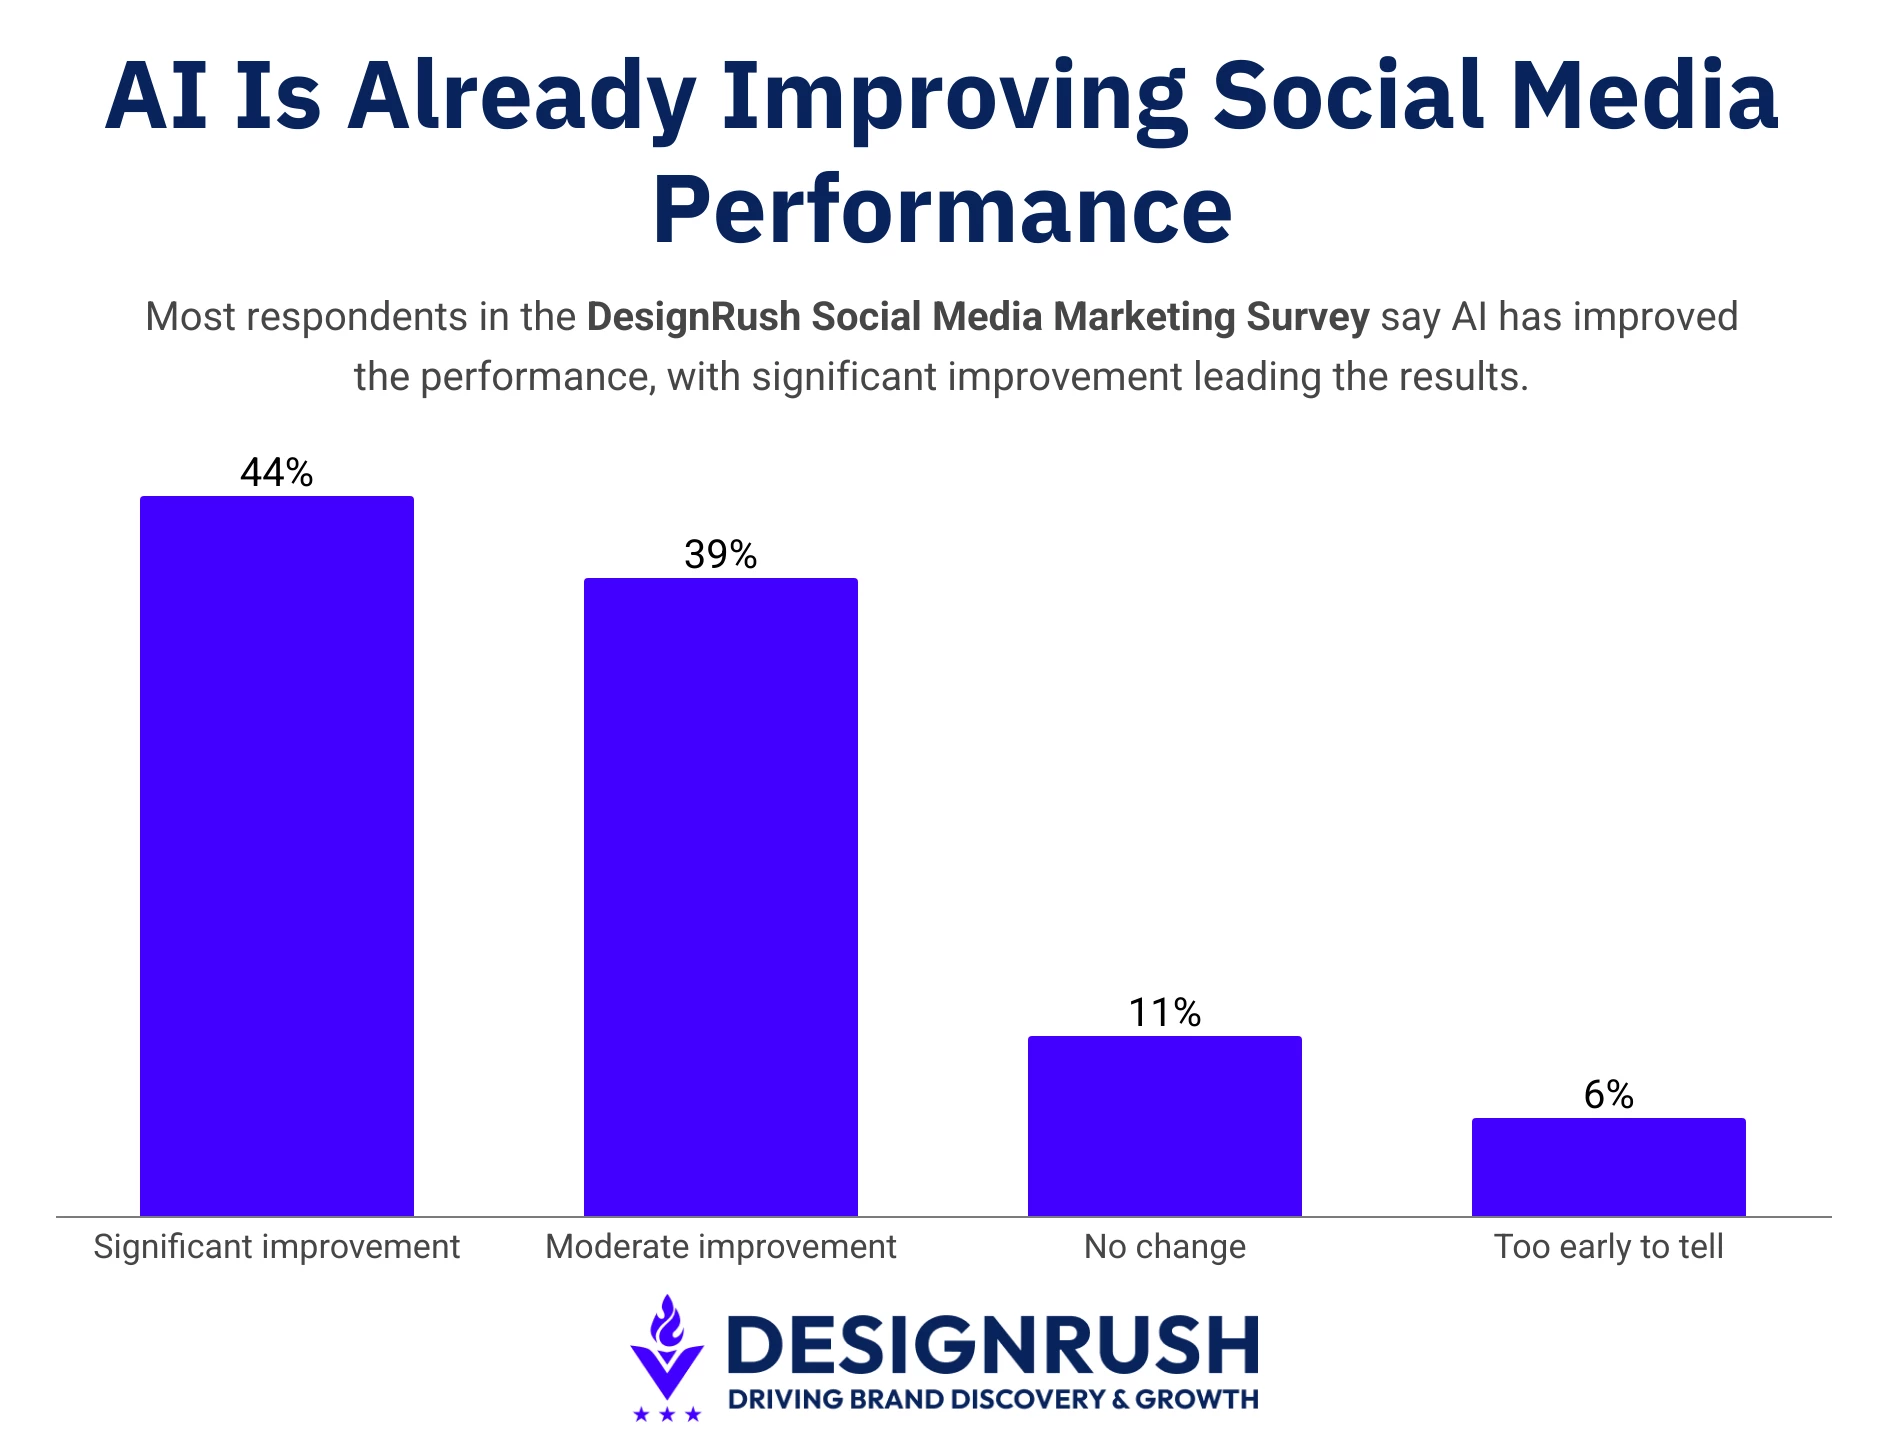
98% of Social Teams Use AI, and Most Are Fighting the Same Problem
The social media statistics show AI adoption in social media marketing is almost universal:
- 98% use AI tools in social media marketing (53% daily, 26% weekly, 19% occasionally).
- 83% report a moderate (39%) or significant (44%) performance improvement.
 What they use it for:
- Post/caption writing: 43%
- Hook ideas / content angles: 19%
- Generating images/creative: 7%
- Repurposing content across platforms: 6%
- Social listening / sentiment analysis: 5%
Smaller shares for scheduling, trend discovery, reporting, and video scripts
The wider industry is moving the same way: in the 2025 Sprout Social Index, 97% of marketing leaders said it's critical that their teams know how to use AI.
Where AI Falls Short
Respondents are clear-eyed about the downside. The biggest risk of AI content, per respondents:
- Content feels generic: 52%
- Brand voice inconsistency: 19%
- Audience distrust: 14%
- None/no downside: 7%
More than half of the people leaning hardest on AI say its main failure mode is blandness.
AI is strongest at speeding up research, drafting, and repurposing. It is weakest at the things that actually differentiate a brand: original point of view, cultural timing, audience judgment, and community management.
Used well, AI clears production friction so humans can spend more time on strategy and voice. But, used lazily, it adds to the generic content everyone is already scrolling past.
Social Search Is Already Working for 81% of Teams Using It
93% of respondents optimize content for social search at least sometimes, with 74% doing it consistently, and 81% say it has driven moderate or significant performance improvement in the past six months.
The social media usage statistics also show where platforms are starting to behave like search engines, with respondents pointing first to channels where users look for answers, compare options, and save useful content for later:
- LinkedIn: 27%
- YouTube: 18%
- Instagram: 17%
- TikTok: 15%
- Not sure / don't track: 11%
- Facebook: 7%
- Reddit: 2%
- Pinterest: 2%
The broader consumer pattern points the same direction across more visual platforms: Sprout Social found 37% of consumers across all age groups now go to social first for product reviews and recommendations.
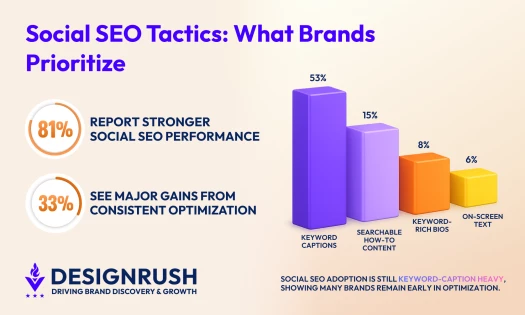
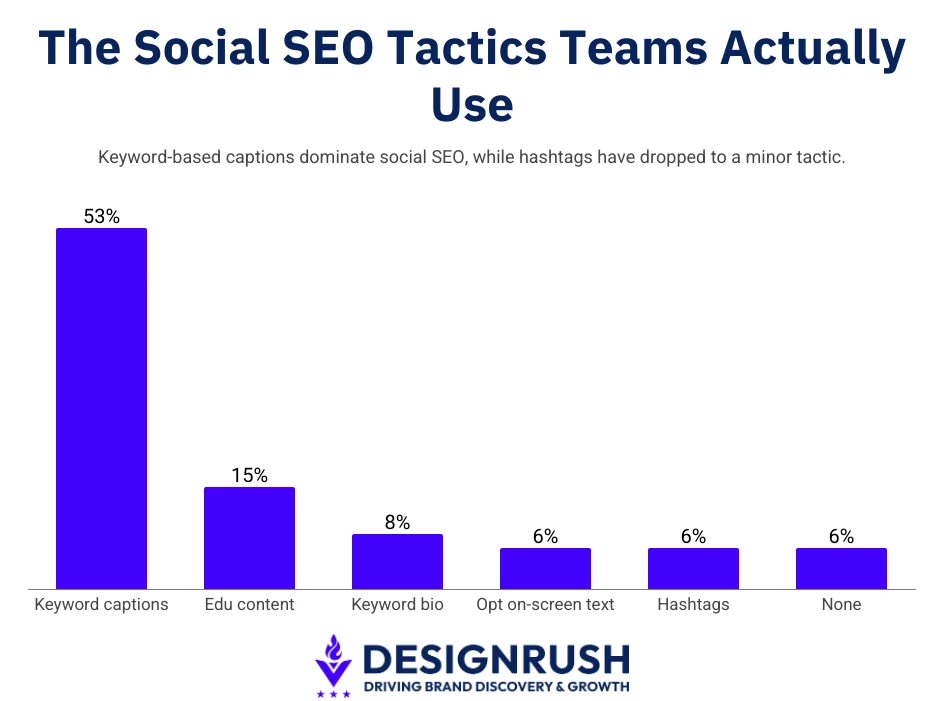
The Social SEO Tactics Teams Actually Use
The tactics teams use most show how social SEO has moved from hashtag stuffing to search intent. Captions now do most of the work, while educational content, optimized profiles, and on-screen text play smaller supporting roles.
- Keyword-based captions: 53%
- How-to / searchable educational content: 15%
- Keyword-rich profile / bio: 8%
- On-screen text optimized for search: 6%
- Hashtag strategy: 6%
- None of the above: 6%
Hashtags have collapsed to a minor tactic, and several respondents called them outright outdated.
Aliza Hughes, Head of Social Media at SAGE Marketing, summed up the shift: "Hashtags — no one searches hashtags anymore. They search full questions and expect full answers."
Final Thoughts: Social Media Marketing Works Faster Than Teams Can Measure It
Whether social media marketing works is not the open question.
90% of social media marketing experts believe it drives revenue, short-form video and social search are delivering, and AI has compressed production timelines for nearly everyone.
The harder problem is measurement and discipline.
Teams still lean on platform-native analytics, only a third can connect social to revenue clearly, and one in ten uses CRM attribution. They spread across platforms that never convert presence into results. And the same teams using AI daily name generic content as its biggest risk.
The brands that win in 2026 will build social around the things this survey rewards, which are searchable content, real community, and posts worth saving, then hold it to business outcomes instead of activity.
To catch up, optimize for social search, concentrate on the two or three platforms that actually convert, use AI to buy back time for original thinking, and wire social data into the CRM.
That last step is what moves the 90% who believe into the 35% who can prove.
| DesignRush Social Media Marketing Benchmark Survey, conducted June 2026. Respondents include agency professionals (74%), brand owners/founders (17%), in-house teams (5%), and freelancers (4%). Primary markets include North America (47%), global markets (42%), and Europe/UK (10%). |
Our team ranks agencies worldwide to help you find a qualified partner. Visit our Agency Directory for the top social media marketing companies, as well as:
- Top Digital Marketing Agencies
- Top AI Marketing Companies
- Top AI Market Research Companies
- Top Content Marketing Agencies
- Top Direct Marketing Companies
Our design experts also recognize the most innovative design projects across the globe.
Given the recent uptick in video on social media, you'll want to visit our Awards section for the best & latest in social media videography designs.
Social Media Marketing Statistics FAQs
1. What are the most important social media marketing statistics for 2026?
The standout from DesignRush’s survey: 90% are confident social drives revenue, but only 35% can connect it to revenue clearly. Beyond that, 77% say short-form video performs best, 98% now use AI tools, and 93% optimize content for social search. Across all of them, the move is from activity metrics toward business outcomes.
2. Which social media platform is best for marketing in 2026?
It depends on your audience, but the data offers a strong heuristic: Compare where you're active against where you actually get results. In our sample, LinkedIn led both usage (86%) and results (60%), with Instagram close behind. Facebook, YouTube, TikTok, and others showed a much wider gap between effort and payoff. Run that audit on your own accounts before adding platforms.
3. How do you measure social media ROI?
Move beyond platform-native analytics, which 39% of teams still rely on as their primary method. The teams that connect social to revenue clearly tend to combine UTMs, multi-touch attribution, and, most importantly, CRM and lead data. Only 10% currently use CRM attribution, which is exactly why most teams can prove social media marketing's value only partially.
4. What social media metrics matter most?
Social media marketing experts trust intent signals over vanity metrics: 40% named leads/purchases as the most valuable engagement metric, followed by shares (14%) and comments (10%). Likes came last at 2%. Saves and shares are treated as proxies for value and usefulness, as 57% read a share as a signal of high usefulness.
5. How is AI changing social media marketing?
AI is now embedded in the workflow with 98% of respondents using it, 53% of them daily, mainly for caption writing and hook ideation, and 83% report a performance lift. The limit is differentiation: 52% say AI's biggest risk is content that feels generic. AI speeds up research and production, but brand voice, cultural timing, and community judgment still need a human.