User experience makes all the difference when it comes to keeping customers around, growing revenue, and building brand loyalty. If you’re leading an agency, managing a product, or running marketing, understanding what makes a great UX is how you stay ahead.
UX Statistics: Key Findings
- Every $1 invested in UX can return up to $100, delivering a potential 9,900% ROI.
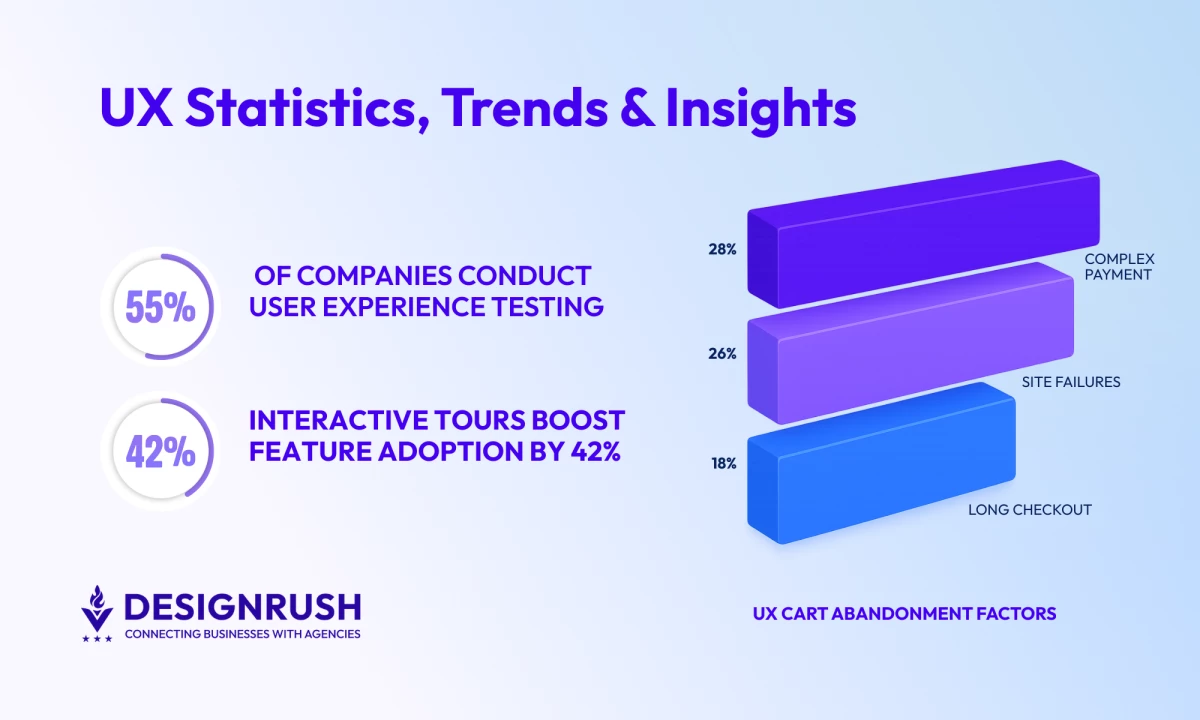
- 55% of companies are currently conducting user experience testing, signaling growing recognition of UX as a core business practice.
- Just a 1-second to 10-second increase in mobile page load time leads to a 123% higher bounce probability.
How UX Statistics Reveal What Shapes Modern Digital Experiences
For agencies and digital leaders, these user experience statistics make one thing clear: better UX drives growth.
Use these stats to prove it — smart UX boosts ROI, cuts costs, and builds advantages over your competitors.
UX Statistics That Show the Business Impact of Good Design
You’ll see the impact of good user experiences on conversions, retention, trust, and overall business performance. The following UX stats demonstrate how UX decisions directly affect customer behavior, engagement, and long-term revenue growth.
- UX statistics that prove revenue impact
- Website speed and conversion performance
- User trust and first impressions
1. UX Statistics That Prove Revenue Impact
A worthwhile UX investment should create measurable financial outcomes. These statistics connect UX improvements directly to conversion rates, retention, and long-term profitability.
Conversion Optimization and Revenue Growth
Improving usability, clarity, and customer flow often leads directly to higher conversions and stronger business performance.
- According to research by Baymard, fixing checkout UX can boost conversions by 35%.
- According to BNP Engage, strategic, relevant CTAs can raise revenue by 83%.
- Real photos on CTAs can increase conversions by 17%.
- Good UI can boost conversions by 200%; strong UX up to 400%.
Retention and Long-Term Business Value
Retention remains one of the most valuable outcomes of a strong user experience strategy.
- Every $1 invested in UX can return up to $100 — a 9,900% ROI.
- Design-led companies outperformed the S&P by 228% over 10 years.
- A 5% boost in retention can grow profits by 25–95% — UX drives that.
2. Website Speed and Conversion Performance
Website speed remains one of the biggest contributors to user engagement and conversion rates. Faster experiences reduce friction, improve search visibility, and help keep users moving through the customer journey.
- A study by Portent found that sites that load in 0–4 seconds see the best conversion rates.
- The same Portent study claims that 82% of B2B pages load in 5 seconds or less.
- According to the findings of that study, B2B sites loading in 1 second convert 3× better than those at 5 seconds.
- Sites hitting Google’s speed goals (like LCP < 2.5s) rank higher in search.
- Top sites load in 2.5 seconds on desktop vs. 8.6 seconds on mobile.
- Guidelines recommend ≤3 seconds load times; Hotjar flags bounce rates over 55% as high.
- A study by Databox found that the median session duration was just 2 min 38 sec across industries.
- Slow-loading websites are estimated to cost business owners $6.8 billion annually.
- Sites loading in 1 second convert 1.5× better than those at 10 seconds.
3. User Trust and First Impressions
Users form opinions about brands almost instantly. Design quality, usability, and performance all influence whether visitors stay, convert, or leave for a competitor.
- 88% of users won’t return to a site with poor UX.
- Brands with unappealing design are avoided by 60% of consumers, despite good reviews.
- Databox’s research found a 44% median bounce rate across industries in late 2024.
- 94% of first-impression assessments are design-driven.
According to Marina Marsh, Founder and President of Web Loft, the focus shouldn’t just be on inflating metrics for the sake of it.
“We’re not just chasing numbers,” she explained.
“The goal is quality conversions — turning visitors into long-term, happy customers.” She emphasized that success comes down to building a website that’s more than just visually appealing.
What Can You Learn From This?
- If your UX is bad, users won’t stick around. No second chances.
- Good design isn’t just pretty, it’s persuasive. It sells.
- Fast, smooth websites convert better.
- First impressions are made in milliseconds so make yours count.
- High bounce rates often point to deeper UX problems.
- UX improvements directly affect revenue and profitability.
- Better CTAs and smoother customer flows increase conversions.
- Retention gains compound over time and significantly improve profitability.
- Design-led businesses consistently outperform competitors financially.
- UX should be treated as a growth investment, not just a design initiative.
Why Visitors Leave Websites: User Behavior Statistics Explaining Bounce Rates
User behavior data reveals where friction appears in the customer journey and explains why users abandon websites or apps. It helps you find those common UX issues that reduce engagement, increase bounce rates, and hurt conversions.
Friction Points That Hurt Engagement
Even small usability problems can disrupt the user journey and create drop-offs. The most effective ways to improve digital experiences have always tended to be simplifying navigation and improving clarity.
- Mobile users are 5 times more likely to abandon a task if a site isn’t mobile-optimized.
- If a mobile page takes more than three seconds to load, 53% of visitors will leave the site.
- 57% of users won’t recommend a site with poor mobile experience.
- 28% cite complex payments and 26% blame failures as key frustrations with retailers.
- Baymard’s research found that 19% abandon purchases due to a lack of trust in credit card security.
Consumer Expectations and Experience Quality
Modern users expect seamless, intuitive experiences across every touchpoint. Brands that fail to meet those expectations risk losing both trust and long-term loyalty.
- 81% of consumers trust companies with strong privacy policies.
- A study by Capgemini discovered that 70% prefer using conversational assistants for faster interactions.
What Can You Learn From This?
- Users expect convenience, speed, and clarity at every step.
- Friction in forms, payments, or navigation quickly drives abandonment.
- Mobile optimization is no longer optional.
- Seamless experiences across channels build trust and loyalty.
- Privacy, personalization, and responsiveness all shape how users perceive your brand.
Mobile UX Statistics Shaping User Expectations in 2026
As mobile usage continues to dominate digital traffic, businesses are under increasing pressure to deliver fast, responsive, and intuitive mobile experiences. These statistics highlight how mobile UX affects retention, engagement, and conversion behavior across devices.
- Mobile usage and engagement trends
- Mobile performance and retention challenges
- Cross-device experience and accessibility
1. Mobile Usage and Engagement Trends
Mobile devices now shape how users browse, shop, and interact with brands daily. Businesses that prioritize mobile-first experiences are better positioned to meet evolving customer expectations.
- 1 in 5 users spend over 4.5 hours per day on their mobile phones.
- 75% of Gen Z prefer smartphones over other devices.
- Tooltester found that mobile drives 68.2% of web traffic; desktop just 29.5%.
- 67% of smartphone users prefer brands that localize mobile content.
2. Mobile Performance and Retention Challenges
 Slow loading speeds, poor optimization, and inconsistent experiences continue to create friction for mobile users and negatively affect retention.
- By day 30, Android apps retain just 2.1% of users; iOS, 3.7%.
- 70% of mobile pages take >5s to show above-the-fold content; >7s to fully load.
- Bounce risk jumps 123% when mobile load time increases from 1s to 10s.
- 88% of mobile eCommerce apps score “mediocre” or worse on UX.
3. Cross-Device Experience and Accessibility
Users expect experiences to feel seamless regardless of device, platform, or screen size. Accessibility and consistency play an increasingly important role in user satisfaction.
- Baymard’s audits found that 94% of top eCommerce sites fail basic WCAG 2.1 AA checks.
- 83% of consumers expect a seamless experience across all devices.
What Can You Learn From This?
- Mobile is now the primary customer touchpoint for many brands.
- Speed, responsiveness, and usability directly influence retention.
- Users expect consistency across devices and platforms.
- Accessibility gaps still represent a major UX weakness for many businesses.
- Mobile-first UX strategies are essential for long-term growth.
Daniel Kodam, tech founder and CEO of D-Kode, emphasized that creating successful mobile apps still hinges on timeless principles.
He stated that “winning over users today demands the same things as 15 years ago,” pointing to the enduring importance of intuitive design.
Kodam added that “UX/UI is the backbone of a strong application,” stressing that easy user experiences and effective interfaces remain critical to product success.
Industry-Specific UX Statistics That Shape Digital Experiences
UX expectations vary across industries, but usability, trust, accessibility, and frictionless interactions consistently influence how users engage with digital platforms.
These user experience stats show how UX decisions affect customer behavior, conversions, and brand perception across sectors like eCommerce, healthcare, B2B, and financial services.
- eCommerce UX and checkout behavior
- Healthcare UX and digital trust
- B2B UX and the modern buyer journey
- Financial services UX and customer trust
1. eCommerce UX and Checkout Behavior
In eCommerce, UX directly affects revenue generation. From product discovery to checkout completion, every interaction influences whether customers continue shopping or abandon their purchase altogether.
Cart Abandonment and Checkout Friction
Checkout remains one of the biggest friction points in online retail. Simplifying the process can significantly improve conversions and reduce lost revenue.
- Baymard reports ~70% average cart abandonment rate.
- Baymard also reports that 18% of shoppers recently ditched orders due to long or complex checkout.
- Smart Insights show abandonment rates spiking to 79% on mobile vs. 68% on desktop.
- Research done by Firework states mobile cart abandonment averages 85.7%, vs. 73% on desktop.
- Firework estimates $18B lost yearly to cart abandonment.
Homepage UX Stats
Homepage usability influences whether users continue exploring a website or abandon it within seconds, making navigation clarity and content accessibility especially important.
- Baymard’s audits found that 59% of eCommerce sites use overly aggressive pop-ups.
- 75% implement homepage carousels ineffectively.
- 22% bury or minimize the search field despite search being a primary navigation tool.
Product Page UX Stats
Product page UX directly affects purchase confidence, helping users evaluate products, compare options, and make informed buying decisions more easily.
- 42% of users struggle to determine product size or dimensions clearly.
- 64% of users actively look for shipping costs before purchasing, yet 43% of sites hide them.
- 80% of eCommerce sites fail to properly surface negative reviews.
Retail Conversion Benchmarks
Retail conversion performance varies significantly by category, platform, and user experience quality.
- Smart Insights also found that retail conversion rates sit at 2–4%. The number is higher for grocery (3–4%) and lower for luxury (~1%) stores.
- Add-to-cart micro conversion rates are ~6–7%.
- Only ~50% of sessions reach product pages in a typical funnel.
2. Healthcare UX and Digital Trust
In healthcare and biotech, UX plays a critical role in establishing credibility, improving accessibility, and helping users navigate complex information with confidence.
- 75% say digital tools simplify healthcare interactions.
- 45% of patients say they trust digitally advanced healthcare providers more.
Real-World Example: Priovant Therapeutics
For Priovant Therapeutics, Washington DC-based agency Design In DC created a streamlined digital experience with intuitive navigation and accessible content structure. This helps present complex healthcare information in a clearer and more user-friendly way.
The project shows how strong UX can reinforce credibility and professionalism in trust-driven industries like healthcare and biotech.
3. B2B UX and the Modern Buyer Journey

B2B buying journeys are increasingly shaped by the quality of digital product experiences. UX is a critical factor in how businesses evaluate and choose vendors.
- 90% of B2B buyers research 2–7 sites before deciding.
- 68% of B2B buyers want brands to understand their personal needs before buying.
- 80% of B2B purchases are driven by UX — not price or product.
4. Financial Services UX and Customer Trust
In financial services and fintech, UX is key for building trust, simplifying complex processes, and helping users feel secure when managing sensitive financial information online.
Research from Signicat showed that 92% of consumers are concerned about how financial service providers use and protect their data.
It also found that 30% of consumers described financial onboarding processes as “complicated,” while 21% abandoned applications because the process took too long.
Real-World Example: Bank of America
Bank of America’s mobile banking app surpassed 40 million active users after continued investment in streamlined mobile UX, personalized financial tools, and simplified digital onboarding experiences.
The company also reported that more than 90% of client interactions now happen through digital channels. That shows how usability and trust directly influence engagement in financial services.
What Can You Learn From This?
- Checkout friction remains one of the biggest revenue leaks in eCommerce.
- Trust and accessibility play a critical role in healthcare and biotech UX.
- B2B buyers increasingly expect frictionless, consumer-grade digital experiences.
- In financial services, usability and transparency strongly influence customer trust.
- Strong UX helps users navigate complex digital experiences with greater confidence.
- Industry-specific UX improvements can significantly influence engagement, retention, and conversion outcomes.
UX Statistics That Reveal What Keeps Users Engaged
These user experience statistics show how onboarding, personalization, and usability influence long-term engagement and retention.
Product Adoption and User Engagement
 Strong onboarding flows and intuitive interfaces improve activation rates and encourage continued product usage.
- Figma leads wireframing tools with 72% usage, thanks to strong collaboration features.
- A report by UserGuiding tells us that interactive product tours boost feature adoption by 42%.
- Personalizing push notifications can increase reaction rates by up to 400%.
- Using a specific, clear CTA can increase conversion rates by 161%.
- Products with strong adoption tools can activate 50–70% of new users, compared to 20–30% for products without them.
Trust, Consistency, and Product Expectations
Users increasingly expect digital products to feel seamless, secure, and personalized across every touchpoint.
- 98% of mobile-web UX rules apply to native apps — users expect consistency.
- In a survey conducted by Cisco, 81% of consumers trust companies with strong privacy policies.
- A study by Capgemini discovered that 70% prefer using conversational assistants for faster interactions.
- Only 55% of companies are currently conducting user experience testing.
What Can You Learn From This?
- UX directly shapes product adoption, retention, and engagement.
- Interactive onboarding helps users discover value faster.
- Consistency across platforms improves usability and trust.
- Personalized experiences increase engagement and adoption.
- Privacy and convenience increasingly influence user expectations.
- Ongoing UX testing is essential for improving digital products over time.
Final Words: From Design Detail to Revenue Driver
The data is clear from these UX stats: better user experiences lead to higher conversions, stronger retention, and measurable business growth.
For agency leaders, CMOs, and digital strategists, now is the time to treat UX metrics as core business KPIs. Benchmark against the best, track what matters, and use UX as a lever to drive long-term value across every digital touchpoint.
![]()
Our team ranks agencies worldwide to help you find a qualified partner. Visit our Agency Directory for the top UI/UX Design companies, as well as:
- Top Web Design Companies
- Top Graphic Design Companies
- Top Digital Design Agencies
- Top Responsive Web Design Companies
- Top Seattle UX Designers
Our design experts also recognize the most innovative design projects across the globe. Given the recent uptick in design, you'll want to visit our Awards section for the best & latest in website designs.
UX Statistics FAQs
1. How does user experience affect business ROI?
Good UX has a direct, proven impact on ROI. Smoother UX leads to higher conversions, which means more sales or sign-ups from the same traffic. It also improves customer retention as users stick with a product longer and spend more if the experience is easy and enjoyable (reducing churn improves lifetime value, which is huge for ROI).
2. Can small agencies or startups really use UX data to win clients or improve products?
Definitely. For agencies, bringing stats and benchmarks into a sales pitch instantly builds credibility. It shows you’re evidence-driven and focused on results.
For startups with limited resources, prioritizing UX improvements based on data ensures you’re working on changes that have the highest impact on customer acquisition or retention.
3. How often should we review and update UX metrics or conduct UX research?
UX is not a “set and forget” element; it’s best treated as an ongoing process. As for metrics, you should be monitoring key UX metrics continuously. But in terms of formal review, a monthly review of core metrics is a good cadence for most teams, with a deeper quarterly analysis to spot trends.
4. Why are user experience stats important for businesses?
User experience stats help businesses understand how design decisions affect customer behavior, conversions, retention, and overall digital performance. Strong UX stats can also help teams identify friction points, benchmark performance, and prioritize improvements that deliver measurable business impact.